Quantcast
Channel: Hacker News 50
Viewing all 9315 articles
Browse latest View live

Your Minimum Viable Product is Processing Credit Cards | Garrick van Buren

$
0
0

Comments:"Your Minimum Viable Product is Processing Credit Cards | Garrick van Buren"

URL:http://garrickvanburen.com/archive/your-minimum-viable-product-is-processing-credit-cards/


If you’re building any sort of web service or mobile app and you can’t yet receive money from people – stop. Right now. Stop. For all that is right in the world – stop.

If you can’t process credit cards right now – you don’t have a product and you barely have a business. Your minimum viable product isn’t _would_ someone pay for it at some price, it’s _can_ someone pay for it at any price. You could be selling nothing right now – I don’t care. You need to figure out how to process credit cards. So, the exact moment you have anything to sell – you’re ready to make that first sale.

Sure, there’s still something of a taboo around asking people to pay for software especially browser-based software – and other text work. Something about a culture of free, marginal cost is $0, economies of scale, SEO-findability, marketshare, blah, blah, blah. It’s bullshit. Part of it’s a remnant from a time when processing credit cards was hard, required merchant accounts, and more security than a $90 HTTPS certificate. The other part is people whose business is to turn interesting software companies into massively awkward advertising companies (MAAC) before selling their interest for a huge profit.

Neither of these things really a problem – the high of making your first sale will quickly evaporate both these notions. There’s a reason restaurants frame their first dollar received. That first sale is a vote of confidence, a recognition of value received, and most of all a ‘Thank you’.

Unlike even 5 years ago, there are plenty of services that will happily process credit card transaction for you – from the ubiquitous PayPal, to Stripe.com, Amazon Payments, and Google Checkout, the list goes on and on. For mobile apps – all the app storefronts will handle payments for you. One caveat – you need to price your app above $0.

Not asking for money guarantees you’ll never receive it. Asking for something only improves your chances that you’ll receive something. Based on my experience, for small services 1% of the people will give you an average of $1. This conversion rate can easily cover hosting costs for a year. It only goes up from there.

Though, the primary benefit of being able to take money isn’t really about being able to take money.

It’s about seeing your product through your potential customers’ eyes. Who they are? Which aspects of what you’re building are most valuable to them? What’s the most valuable thing you could build that they’d open their wallet for? Build that atop your payment processing system. Done. With enough customers, we can talk about bundling features into different payment tiers. Even completely different products. That’s down the road. But now that mindset exists, the technical capability exists, more paths to success open up. All in this small shift from $0 to >$0.

This isn’t even specific to building software – this is for anyone that creates something and distributes it online. Late last year I paid $250 for a weekly 5 minute video series. Announcements of new videos are distributed via email (one of the few emails I look forward to each week). The videos themselves live on Youtube. Last I heard, 160 others had paid as well. That’s $40,000 gross – atop an email with a YouTube link – from the sheer audacity of asking for real money for a year of creative work.


Never Lie About Who You Really Are - Dan Pallotta - Harvard Business Review

$
0
0

Comments:"Never Lie About Who You Really Are - Dan Pallotta - Harvard Business Review"

URL:http://blogs.hbr.org/pallotta/2012/12/never-lie-about-who-you-really-are.html


by Dan Pallotta  |  10:00 AM December 18, 2012

Yesterday was my 12-year anniversary of being with my partner, Jimmy. I called a florist, and a nice woman picked up. I told her, "It's my anniversary, and I want to send roses." I know she's thinking the roses are going to a woman. It doesn't matter that I've been out for 31 years, I still get self-conscious when it comes time to tell her what to put on the card: "Dear Jimmy, etc., Love, Danny." I steel myself for the usual response — "Did you say Jenny?" — but this woman gets it.

Last week, the pest control guy came to the door. "Are you Mr. Smith?" he says. "No, I'm Mr. Pallotta, Mr. Smith's partner," I reply. "Partner?" he asks. I'm being questioned in my own home. "Yes, partner," I answer. "We're a gay couple." "Oh," he says, trying to process this and maintain his composure.

People have the misconception that a gay person comes out once. It's not true. If you're gay and you're authentic, you're coming out constantly. You're on a business trip, for example. A cab driver asks if you have kids, and you say that you do. Then he asks about your wife. Even though you may be exhausted, you find yourself summoning the energy to have a transformative conversation with a total stranger on whom you are depending to get to the airport and whose reaction you have no way of predicting. It takes a few tablespoons of courage. Every time. But you do it. Because it's who you are, and you've learned long ago not to deny who you are or who your partner is. Because to deny who you are is a betrayal of yourself and the man you love and the children you have together. So you never, ever skirt the issue, no matter how tired or busy you are. You become a Jedi with your truth. Not just the truth, but your truth.

Your ability to stand up for your truth is a muscle, and the more you exercise it the stronger it gets. I do a lot of work in the humanitarian sector, and I find that many in the sector have let that muscle atrophy. They get into this work to change the world but get beaten down by the relentless pressure to keep administrative costs low. And that becomes their new mission. They forget how to stand up for their truth, to say, "I came here to change the world, and no one and nothing is going to stop me from doing that."

The for-profit sector is no different. People at all levels, especially management, witness the slow undoing of good customer service, product quality, or safety standards, and they don't say a thing about it. Even if it violates their own value system and the mission of the company. But if everyone at a crummy airline, for example, had the same zero-tolerance for bad customer service as a lesbian has for lying about the fact that she's married to a woman, it wouldn't be a crummy airline for long. To stand up for your truth is to be a leader.

Each of us lives with the reality of products and services that come from companies whose leaders have surrendered their truth about quality and excellence. My parents just bought a flat screen TV from a major manufacturer. The speakers are in the back, pointing away from the viewer, and they can't hear the damned thing. Why is a product like that allowed out the door? Because of a thousand people at a dozen levels remaining silent. We ordered new stools for our kitchen from a hip furniture retailer. They were six weeks late. Throughout those six weeks, the retailer couldn't tell us where they were, because, as the customer service reps explained, the European supplier doesn't communicate with them very well. Why does the company continue to do business with such a supplier? Because no one along the chain will risk being marginalized by making a stink over it. The new Microsoft Surface tablet reportedly rips at the seam where keyboard cover meets tablet. Was it tested for durability? If not, why not? If it was, why was it allowed to go to market with such a defect? Probably because of the same kind of self-talk that goes on in a gay man's head before he's ready to come out: "Why make a big deal of it? It doesn't really matter." But when he finally comes out, he realizes it was the only thing that mattered, and that coming out transformed his life. Speaking the truth can do the same thing for businesses.

How can you develop this "coming out" muscle yourself? First, know what you're coming out about. Identify your truths. Write a personal values manifesto. You can't know if your values are being violated if you're ambiguous about what they are. Second, learn to develop a sixth sense for when your line is being crossed. It may be a gut feeling. A nervous laugh. A habit of rationalizing. Not an hour ago a delivery company called and asked if anyone would be home this afternoon to accept a package. I said, "Yes, my other half, with three sick kids." "That must be fun for her," the guy said. That tiny voice in my head rationalized, "You're about to hang up, let it go." The moment I heard myself say that, a trigger went off and I came out to him with a simple, "She's a he." Rationalization is a red flag for me. Let it be one for you.

So you're not gay. You can still develop the strength to stand up for your truths. Stop trying to think outside the box. Start thinking outside the closet.

Data-driven support — GoCardless Blog

$
0
0

Comments:"Data-driven support — GoCardless Blog"

URL:https://gocardless.com/blog/data-driven-support/


Here at GoCardless, we try to make all our decisions in a data-driven way. Staying customer-centric whilst we do so means making sense of all the interactions we have with our customers.

On the Customer Support team, we spend more time than anyone else speaking to customers. We generate a lot of rich but unstructured data: our email, calls and other interactions. Recently, we’ve been working on new ways to analyse it to improve our support and drive product development.

How things were

When I joined GoCardless we were providing great support but our tracking was ad-hoc. We were manually recording some interactions, but the data was patchy and the process was time-consuming.

Worse still, our support data wasn’t linked with the rest of our data, meaning we weren’t using what we did record. It was buried.

Enter Nodephone

We decided to begin our overhaul of support-tracking with our phone channel, and I set about building a new, metrics-driven system.

We had a good foundation to build on - all external calls come in on a Twilio number and are forwarded to phones in our office. To get good quality tracking I built a system called “Nodephone” to sit in the middle. Built in Node.js with the Express framework and Socket.io, it’s on the other end of Twilio, responding with TwiML, but it also communicates with GoCardless and a web interface.

Any incoming call is logged and looked up in our merchant records. We then display the call on a simple web interface, where the support agent can see the caller’s name and click straight through to their records. At the end of the call, they can add descriptive tags and notes.

Now when customers call we know who they are and can greet them personally! If we don’t recognise their number and we find out who they are on the call, we can save it from the web client for future calls.

All the data entered, alongside the duration of the call, is saved on the merchant’s account for future reference.

Data, data, data

All that data we’re collecting has already proved incredibly useful since we can analyse it to find the trends. For example, we want to know between what hours we should provide support, so I graphed the number of calls in different hours of the day over a typical month:

Clearly the vast majority of people call between 9am and 6pm, so we decided to set our office hours for then. We also use this kind of data to inform recruitment for the customer support team.

We can also see why people are calling - that is, whether they’ve paid via GoCardless (customers), collected money (merchants) or are interested in taking GoCardless payments (prospects) from the tags:

As a start-up that prides itself on reducing friction to signup we were amazed to see so many prospects trying to call us. What’s more, they were finding our number from parts of our site designed for our current users. From the data above, we decided to put our number front and centre on our merchant signup pages - check it out here.

The tags we logged on calls from merchants also showed that there was a lack of helpful information on the site to answer common questions, so we’re revamping our FAQs with a whole range of new content.

What’s next

We’ve built a powerful new automated metrics system for logging our phone calls.

Next we’re targeting our other support channels. We’ll be using Desk’s API to analyse our email support, providing the ability to do all sorts of calculations which aren’t possible with the software’s own analytics.

We're also going to build an internal dashboard so anyone can see the headline stats for support in a couple of clicks.

Over time, we want to make all our internal analytics as powerful as we can. If you find problems like this interesting, we’re hiring and would love to hear from you.

Harry's Tube Runners: I have finally run the entire London Underground

$
0
0

Comments:"Harry's Tube Runners: I have finally run the entire London Underground"

URL:http://harrystuberunners.blogspot.co.uk/2012/08/i-have-finally-run-entire-london.html


The London Underground is 150 years old today, as far as I am aware - and I could be wrong in this assertion - I am the only person to of run the entire network. Let me take you back through the story..

Sunday the 5th August - the day I finally completed running the entire London Underground. 9 months of effort, 12 tube lines, 272 stops, around 450 miles of running, 40 runs, 30 half marathons, fractured feet, strained backs, torn muscles. £21,780 raised for one amazing charity.

12 months ago I took lunch and sat on a bench outside my building when I launched Twitter. Harry Moseley's mum had tweeted a picture of Harry - that picture was to shape my life for the next 12 months. Harry, for those who don't know, was, is, an incredible young man. Diagnosed with an inoperable brain tumour at the age of 7, Harry decided he wanted to help others to ensure they didn't suffer like him. So despite being gravely ill Harry made bracelets to make money for his campaign 'Help Harry Help Others'. That day in August though was the day Harry had an operation, at just 11, to remove part of a tumour. Harry was to never wake from this operation.

As I sat there and clicked the picture, it opened up to show Harry, an unconscious Harry, hugging a teddy bear. It also showed a hugely swollen head, a cut head, his eyes were shut but he looked in such pain. This picture should not be allowed to exist. An 11 year old should be happy, care free, enjoying his life. Harry looked so battered, so bruised, he looked so very tired. People flanked me left and right on the bench but I could not help my uncontrollable sobbing. I got up and I ran. Whenever I get upset I run. No idea why but it’s always been the same – whenever I get really upset, no matter where I am, I just run. I have cried 4 times as an adult – when my granddad died, when my Nan died, when my friend died and that picture. I ran from Aldgate all the way to Baker Street because I was so upset. No idea why I chose that route. No idea why I stopped at Baker Street. It was 2PM, I was sitting on a step with cut feet (I’d been running in work shoes), I was out of breath, I was upset and it then dawned on me…I was meant to be at work. I quickly got up and jumped on the tube. I got on the Circle line train to Aldgate and the whole way I sat staring at the photo of Harry and knowing I needed to do something. I needed to raise money, raise awareness – I needed to help. I could not look at another photo, of a young person, like that ever again. But what could I do?

I knew it had to be fairly off the wall. I knew I wanted to raise money quickly and I wanted to do it – whatever ‘it’ was quickly so that I could get the money to his charity quickly. Great Portland Street arrived and went. Still thinking. Euston Square been and gone. Still thinking. Kings Cross done and dusted. Still thinking. Then I realised, I was travelling on the tube where I’d just run. I was doing the exact same route. I looked up at the Circle line map that was on the tube. I counted the stops and stood up. It all just clicked. Suddenly I knew. I would run the Circle line. Now that may seem to be a strange epiphany but it felt right. I felt it in my gut. But it had to be made tougher, more ridiculous, for people to donate. So I decided I would run the Circle line on Saturday, August 20. That gave me 6 days. I would set a fundraising target of £1500. It is at this point I should say that my run from Aldgate to Baker Street is the furthest I have ever run – I am not a runner. Still how far could the Circle line be?

I got back to my desk, red faced and bloodied feet, and immediately put the process documents on the floor. I had 4 missed calls on my desk phone and 13 emails. They would wait. I jumped straight on to Google and launched Google Maps. I put all the stations in. It turned out the Circle line was quite far! Scrap that, very far. The Circle line was 19 miles. It’s at moments like this that I ring my dad. I attempt to seek confirmation, reassurance, that I Steven James Henry Whyley can do what I am suggesting. My dad, the oracle, can give me that confirmation.

“You want to do what?”
“It’s how far?”
“You want to raise how much?”
“SATURDAY!”.

My dad was in. I’d persuaded him we could do this. It was settled – I would run all 19 miles of the Circle line on Saturday and I would raise £1500 in the process – all money raised going to Harry’s charity.

Ten minutes later and I had set up a Justgiving site. A Justgiving site is a cool way to collect money – it’s like your own website and saves you from having to go round with a bucket to collect money. My site www.justgiving.com/steven-whyley had a target of £1500 and so far £0 had been raised. I put together an email (at work!) and sent it to my whole department. The email was pretty simple:

Afternoon All,

As you know I am quite a stupid person. It is because I am a stupid person that I have decided to run all 19 miles of the Circle line on Saturday. I have done no training. I am not a runner. Now I know you guys are not stupid people. Look at this photo – let’s help raise money for this boy’s amazing charity and if we do and others like us do then you’ll never have to see this type of photo again.

www.justgiving.com/steven-whyley is the link. I promise to do more work if you sponsor me.

Steve

52 minutes later and I had raised £160.

I put on Facebook a status requesting money and asking if anyone fancied running with me. Three people immediately messaged me – Shaun Purvis, Luke Butler and Martin Chapman. They all messaged me saying ‘Yes, yes they would run’. Two other girls - Chloe Garrard and Becky Eighteen also said they wanted to run.

That was it - 6 of us - would run the circle line. We did run the circle line, it was very, very difficult but we'd done it. I went off to do some travelling and that was the end of the tube running madness.

In October Harry died.

At this point I knew I wanted to do more, to help contribute to the brilliant charity Harry had set up. I said to the original runners that I would try and run every single tube line on the London Underground. All 450 miles of it. I would run every single run and then the guys would help me when they could.

In October I started, without training, and ran all 22 miles of the Bakerloo line, after work. This is the thing that a lot of people do not realise about this challenge - a lot of it happens after work. I, along with my dad and a mate or two, take a tube out to our destination - often an hour away, and then run back as far in as we could. My dad works out the route for me, I run with google maps on my phone in my hand and meet my dad every 3 stops for a water and a Mars. We often didn't get home til 10 or 11 that night and then I'd have to get up for work the next day. It was brutal - more brutal than I could of imagined.

I had set a target of £10,000 that I wanted to raise - hugely ambitious and almost certainly unachievable. But I find, if you set improbable goals then it makes you try that much harder to turn the improbable probable.

So we ran. We ran out to places like Harrow, Heathrow, Uxbridge, Epping, Chesham, Watford, Upminster and ran in all weathers, at all times. Over the 9 months Martin Chapman and Luke Butler must have run 25-30 runs - they've been incredible. Shaun Purvis, Chloe Garrard and Becky Eighteen have all run at least 5 runs but importantly they've all raised massive sums of money for the charity. It's incredible what these people have done.

August 5th 2012, I had just run 6 half marathons in 12 days. Most of those with Luke and Martin - but some with special appearances from friends. The support we've received has been incredible - from Twitter to Facebook, so many have got behind us. We've had over 330 donations. Incredible how generous people are - never give on people because they continue to amaze.

Our final run - Preston Road to Aldgate. One of the most amazing days of my life - I'd got to the end and my dad was here for it. My dad had had a stroke whilst all of this running was going on and for him to be back was all the inspiration I needed to finish. Amazingly we were joined by Mitch Wilson and the UK karate team. We were also joined by tens of friends. By the end of the run there were 30 people running and at the finishing line there were 20 people waiting for us. At least 50 people came up to support us.

I have run in quite a bit of pain but the support I have received has numbed all of that pain - it has been simply incredible.

All that's left for me to say is that we made the improbable probable - we raised £21,780. We ran the entire London Underground. Truth be told I started these runs for Harry, to help Harry and his charity. When I crossed that finishing line though, I realised Harry has helped me. I've made so many friends, fallen in love, forged such a close relationship with my dad that I will be forever grateful for, and realised that I can do anything I want if I want it enough. If I am inspired. And if I surround myself with great people.

Thank you all so much for helping me finish this. £21,780 to Harry's charity - that's a full time salary for a nurse to help families like Harry deal with brain cancer. I may have done some running, but you made the difference.

And as for the London Underground - 150 years old today, you changed my life.

Steve
www.justgiving.com/steven-whyley

Two star programming

$
0
0

Comments:"Two star programming"

URL:http://wordaligned.org/articles/two-star-programming


2013-01-08 • C, Torvalds, AlgorithmsComments

A few weeks ago Linus Torvalds answered some questions on slashdot. All his responses make good reading but one in particular caught my eye. Asked to describe his favourite kernel hack, Torvalds grumbles he rarely looks at code these days — unless it’s to sort out someone else’s mess. He then pauses to admit he’s proud of the kernel’s fiendishly cunning filename lookup cache before continuing to moan about incompetence.

At the opposite end of the spectrum, I actually wish more people understood the really core low-level kind of coding. Not big, complex stuff like the lockless name lookup, but simply good use of pointers-to-pointers etc. For example, I’ve seen too many people who delete a singly-linked list entry by keeping track of the prev entry, and then to delete the entry, doing something like if (prev) prev->next = entry->next; else list_head = entry->next; and whenever I see code like that, I just go “This person doesn’t understand pointers”. And it’s sadly quite common. People who understand pointers just use a “pointer to the entry pointer”, and initialize that with the address of the list_head. And then as they traverse the list, they can remove the entry without using any conditionals, by just doing a *pp = entry->next.

Well I thought I understood pointers but, sad to say, if asked to implement a list removal function I too would have kept track of the previous list node. Here’s a sketch of the code:

This person doesn’t understand pointers

typedef struct node
{
 struct node * next;
 ....
} node;
typedef bool (* remove_fn)(node const * v);
// Remove all nodes from the supplied list for which the 
// supplied remove function returns true.
// Returns the new head of the list.
node * remove_if(node * head, remove_fn rm)
{
 for (node * prev = NULL, * curr = head; curr != NULL; )
 {
 node * next = curr->next;
 if (rm(curr))
 {
 if (prev)
 prev->next = curr->next;
 else
 head = curr->next;
 free(curr);
 }
 else
 prev = curr;
 curr = next;
 }
 return head;
}

The linked list is a simple but perfectly-formed structure built from nothing more than a pointer-per-node and a sentinel value, but the code to modify such lists can be subtle. No wonder linked lists feature in so many interview questions!

The subtlety in the implementation shown above is the conditional required to handle any nodes removed from the head of the list.

Now let’s look at the implementation Linus Torvalds had in mind. In this case we pass in a pointer to the list head, and the list traversal and modification is done using a pointer to the next pointers.

Two star programming

void remove_if(node ** head, remove_fn rm)
{
 for (node** curr = head; *curr; )
 {
 node * entry = *curr;
 if (rm(entry))
 {
 *curr = entry->next;
 free(entry);
 }
 else
 curr = &entry->next;
 }
}

Much better! The key insight is that the links in a linked list are pointers and so pointers to pointers are the prime candidates for modifying such a list.

§

The improved version of remove_if() is an example of two star programming: the doubled-up asterisks indicate two levels of indirection. A third star would be one too many.

Article 6

When EC2 Hardware Changes Underneath You… | PiCloud Blog

$
0
0

Comments:"When EC2 Hardware Changes Underneath You… | PiCloud Blog"

URL:http://blog.picloud.com/2013/01/08/when-ec2-hardware-changes-underneath-you/


At PiCloud, we’ve accumulated over 100,000 instance requests on Amazon EC2. Our scale has exposed us to many odd behaviors and outright bugs, which we’ll be sharing in a series of blog posts to come. In this post, I’ll share one of the strangest we’ve seen.

The Bug

It started with a customer filing a support ticket about code that had been working flawlessly for months suddenly crashing. Some, but not all, of his jobs were failing with an error that looked something like:

Fatal Python error: Illegal instruction

File “/usr/local/lib/python2.6/dist-packages/numpy/linalg/linalg.py”, line 1319 in svd

File “/usr/local/lib/python2.6/dist-packages/numpy/linalg/linalg.py”, line 1546 in pinv

That’s odd, I thought. I had never before seen the Python interpreter use an Illegal Instruction! Naturally, I checked the relevant line that was crashing:

results = lapack_routine(option, m, n, a, m, s, u, m, vt, nvt, work, lwork, iwork, 0)

A call to numpy’s C++ lapack_lite. Great, the robust numpy was crashing out.

More surprising was that a minority of jobs were failing, even though the customer indicated that all jobs were executing the problematic line. We did notice that the job failures were linked to just a few servers and those few servers ran none of the customer’s jobs successfully. Unfortunately, our automated scaling systems had already torn down the server.

Debugging

The first thing I did was Google the error. Most results were unhelpful, but one old, though now solved, bug with Intel’s Math Kernel Library (MKL) seemed notable. MKL would crash with an illegal instruction error when AVX (Advanced Vector Extensions, a 2011 extension to x86) instructions were being executed on CPUs that lacked support. Why notable? We compile numpy and scipy libraries with MKL support to give the best possible multi-threading performance, especially on the hyperthreading & AVX capable f2 core.

Still though, why did only a few servers crash out? Having not much to go on, I launched a hundred High-Memory m2.xlarge EC2 instances (200 m2 cores in PiCloud nomenclature) and reran all the user’s jobs over the nodes. A few jobs, all on the same server, failed.

As I compared the troublesome instance to the sane ones, one difference stood out. The correctly operating m2.xlarge instances were running 2009-era Intel Xeon X5550 CPUs. But the troublesome instance was running a more modern (2012) Xeon E5-2665 CPU. And returning back to the MKL bug noted earlier, this new chip supported AVX.

Examining /proc/cpuinfo showed as much; AVX was supported on the failing instance, but not the new ones. To test it out, I compiled some code from stackoverflow with ‘g++ -mavx”. Sure enough, running the binary produced an Illegal Instruction.

From my perspective as an instance user, the processor was lying, claiming to support AVX but actually crashing when any AVX code would run.

Analysis

Turns out the actual answer was subtle. Per the Intel manual, it is possible for the operating system to disable AVX instructions by disabling the processor’s OSXSAVE feature. By the spec, any application wishing to use AVX first must check if OSXSAVE is enabled.

Amazon seems to have disabled the OSXSAVE feature at the hypervisor layer on their new Xeon E5-2665 based m2.* series of instances. This may just be because their version of the Xen hypervisor that manages these instances lacks support for handling AVX registers in context switching. But even if support does exist in the hypervisor, it makes sense to disable AVX for the m2.* family as long as there are Xeon X5550 based instances. Imagine compiling a program on an m2.xlarge EBS instance, thinking you had AVX support, and then upon stopping/starting the instance, finding that the program crashes, because your instance now runs on older hardware that doesn’t have AVX support! A downside of VM migration is that all your hardware must advertise the least common denominator of capabilities.

Unfortunately, Amazon did not ensure that the Guest OS saw that OSXSAVE was disabled. This led to MKL thinking it had the capabilities to run AVX code, when it actually didn’t.

Ultimately, there was not much to do but:

Given how rare the Xeon E5-2665 instances are, we now simply self-destruct if an m2.*’s /proc/cpuinfo claims that both avx and xsave is enabled File a support case with Amazon. They have been quite responsive and as I publish this post, it seems that a fix has at least been partially pushed.

So, if you use instances in the m2.* family, be sure to check /proc/cpuinfo. If the instance claims it has both avx and xsave, it is probably lying to you.

Alternatively, if you are doing high performance computation in the cloud, you may just want to pass on the responsibility for such dirty details to us at PiCloud.

Tags: avx, ec2 bugs

Categories: Battle Stories

You can follow any responses to this entry through the RSS 2.0 feed.

The Story of the PING Program

$
0
0

Comments:" The Story of the PING Program "

URL:http://ftp.arl.army.mil/~mike/ping.html


Yes, it's true! I'm the author ofping for UNIX. Ping is a little thousand-line hack that I wrote in an evening which practically everyone seems to know about. :-)

I named it after the sound that a sonar makes, inspired by the whole principle of echo-location. In college I'd done a lot of modeling of sonar and radar systems, so the "Cyberspace" analogy seemed very apt. It's exactly the same paradigm applied to a new problem domain: ping uses timed IP/ICMP ECHO_REQUEST and ECHO_REPLY packets to probe the "distance" to the target machine.

My original impetus for writing PING for 4.2a BSD UNIX came from an offhand remark in July 1983 by Dr. Dave Mills while we were attending a DARPA meeting in Norway, in which he described some work that he had done on his "Fuzzball" LSI-11 systems to measure path latency using timed ICMP Echo packets.

In December of 1983 I encountered some odd behavior of the IP network at BRL. Recalling Dr. Mills' comments, I quickly coded up the PING program, which revolved around opening an ICMP style SOCK_RAW AF_INET Berkeley-style socket(). The code compiled just fine, but it didn't work -- there was no kernel support for raw ICMP sockets! Incensed, I coded up the kernel support and had everything working well before sunrise. Not surprisingly, Chuck Kennedy (aka "Kermit") had found and fixed the network hardware before I was able to launch my very first "ping" packet. But I've used it a few times since then. *grin* If I'd known then that it would be my most famous accomplishment in life, I might have worked on it another day or two and added some more options.

The folks at Berkeley eagerly took back my kernel modifications and the PING source code, and it's been a standard part of Berkeley UNIX ever since. Since it's free, it has been ported to many systems since then, including Microsoft Windows95 and WindowsNT. You can identify it by the distinctive messages that it prints, which look like this:

In 1993, ten years after I wrote PING, the USENIX association presented me with a handsome scroll, pronouncing me a Joint recipient of The USENIX Association 1993Lifetime Achievement Award presented to the Computer Systems Research Group, University of California at Berkeley 1979-1993. ``Presented to honor profound intellectual achievement and unparalleled service to our Community. At the behest of CSRG principals we hereby recognize the following individuals and organizations as CSRG participants, contributors and supporters.'' Wow!

From my point of view PING is not an acronym standing for Packet InterNet Grouper, it's a sonar analogy. However, I've heard second-hand that Dave Mills offered this expansion of the name, so perhaps we're both right. Sheesh, and I thought the government was bad about expanding acronyms! :-)

Phil Dykstra added ICMP Record Route support to PING, but in those early days few routers processed them, making this feature almost useless. The limitation on the number of hops that could be recorded in the IP header precluded this from measuring very long paths.

I was insanely jealous when Van Jacobson of LBL used my kernel ICMP support to write TRACEROUTE, by realizing that he could get ICMP Time-to-Live Exceeded messages when pinging by modulating the IP time to life (TTL) field. I wish I had thought of that! :-) Of course, the real traceroute uses UDP datagrams because routers aren't supposed to generate ICMP error messages for ICMP messages.

The best ping story I've ever heard was told to me at a USENIX conference, where a network administrator with an intermittent Ethernet had linked the ping program to his vocoder program, in essence writing:

The book by this title has nothing to do with networking, but that didn't prevent a reader from Upper Volta, Uzbekistan contributing this short but delightful review, which was was briefly seen at the Amazon.Com bookseller web site, and is saved here as part of the story about the other ping. *grin*

The Story About Ping by Marjorie Flack, Kurt Wiese (Illustrator)

Reading level: Baby-Preschool

Paperback - 36 pages (August 1977). Viking Pr; ISBN: 0140502416 ; Dimensions (in inches): 0.17 x 8.86 x 7.15

================================================================

Reviews

The tale of a little duck alone on the Yangtze River, The Story About Ping is a sweet and funny book with wonderfully rich and colorful illustrations. On a day like any other, Ping sets off from the boat he calls home with his comically large family in search of "pleasant things to eat." On this particular day, he is accidentally left behind when the boat leaves. Undaunted, the little duck heads out onto the Yangtze in search of his family, only to find new friends and adventures--and a bit of peril--around every bend.

The exceptional illustrations bring the lush Yangtze to life, from Ping's family to the trained fishing birds he finds himself among to the faithfully rendered boats and fishermen. Certainly intended to be read aloud, The Story About Ping deserves a place on every young reader's (or listener's) shelf. (Picture book)

Synopsis

A childhood classic. "Kurt Wiese and Marjorie Flack have created in Ping a duckling of great individuality against a background (the Yangtze River) that has both accuracy and charm."--The New York Times. Full-color illustrations.

Synopsis of the audio cassette edition of this title: A little duck finds adventure on the Yangtze River when he is too late to board his master's houseboat one evening.

Card catalog description: A little duck finds adventure on the Yangtze River when he is too late to board his master's houseboat one evening.

================================================================

Customer Comments

A reader from Upper Volta, Uzbekistan, March 7, 1999

Excellent, heart-warming tale of exploration and discovery. Using deft allegory, the authors have provided an insightful and intuitive explanation of one of Unix's most venerable networking utilities. Even more stunning is that they were clearly working with a very early beta of the program, as their book first appeared in 1933, years (decades!) before the operating system and network infrastructure were finalized.

The book describes networking in terms even a child could understand, choosing to anthropomorphize the underlying packet structure. The ping packet is described as a duck, who, with other packets (more ducks), spends a certain period of time on the host machine (the wise-eyed boat). At the same time each day (I suspect this is scheduled under cron), the little packets (ducks) exit the host (boat) by way of a bridge (a bridge). From the bridge, the packets travel onto the internet (here embodied by the Yangtze River).

The title character -- er, packet, is called Ping. Ping meanders around the river before being received by another host (another boat). He spends a brief time on the other boat, but eventually returns to his original host machine (the wise-eyed boat) somewhat the worse for wear.

The book avoids many of the cliches one might expect. For example, with a story set on a river, the authors might have sunk to using that tired old plot device: the flood ping. The authors deftly avoid this.

Who Should Buy This Book

If you need a good, high-level overview of the ping utility, this is the book. I can't recommend it for most managers, as the technical aspects may be too overwhelming and the basic concepts too daunting.

Problems With This Book

As good as it is, The Story About Ping is not without its faults. There is no index, and though the ping(8) man pages cover the command line options well enough, some review of them seems to be in order. Likewise, in a book solely about Ping, I would have expected a more detailed overview of the ICMP packet structure.

But even with these problems, The Story About Ping has earned a place on my bookshelf, right between Stevens' Advanced Programming in the Unix Environment, and my dog-eared copy of Dante's seminal work on MS Windows, Inferno. Who can read that passage on the Windows API ("Obscure, profound it was, and nebulous, So that by fixing on its depths my sight -- Nothing whatever I discerned therein."), without shaking their head with deep understanding. But I digress.

================================================================

Melissa Rondeau from Braintree, MA , March 11, 1999

I collect reference books about the UNIX operating system. PING (short for Packet InterNet Groper) has always been one of those UNIX commands whose usefulness transcends its own simplicity. A coworker told me about a book dedicated to this one command, "The Story About PING." I was a little surprised that an entire book was devoted to the history of this UNIX command, but the price was certainly affordable, so I ordered it from a distributor. What arrived was actually an illustrated story book for young children. I thought it was a mistake, but my coworker told me later he was just playing a prank. I did read the book on the plane while traveling on business, and I have to admit, it's one of the finest pieces of children's literature I have ever read. A classic tale of adventure and innocence, with an important lesson to be learned. Not what I originally expected, but an enjoyable read none the less.

================================================================

A reader from Houston, TX , November 25, 1998

A wonderful, timeless story of family, adventure and home I can remember Captain Kangaroo reading this book on his TV show and that was probably 30 years ago. A very delightful book which allows children to understand responsiblity, adventure, family and home. The story is simple and uncluttered, a small duck who decides to avoid the punishment due the last duck to board the boat each night - a whack on the back, by hiding and not boarding with the rest of the ducks.

Ping has his adventure and returns to the boat and his family, wiser yet innocent. Great story to share with your children.

================================================================

A reader from brunswick, jersey , November 30, 1997

I grew up on Ping and I love it still. I'm 21 now and buying it for every friend with a kid. Its clean, its fun, and its just great.


Probability Theory — A Primer | Math ∩ Programming

$
0
0

Comments:"Probability Theory — A Primer | Math ∩ Programming"

URL:http://jeremykun.com/2013/01/04/probability-theory-a-primer/


It is a wonder that we have yet to officially write about probability theory on this blog. Probability theory underlies a huge portion of artificial intelligence, machine learning, and statistics, and a number of our future posts will rely on the ideas and terminology we lay out in this post. Our first formal theory of machine learning will be deeply ingrained in probability theory, we will derive and analyze probabilistic learning algorithms, and our entire treatment of mathematical finance will be framed in terms of random variables.

And so it’s about time we got to the bottom of probability theory. In this post, we will begin with a naive version of probability theory. That is, everything will be finite and framed in terms of naive set theory without the aid of measure theory. This has the benefit of making the analysis and definitions simple. The downside is that we are restricted in what kinds of probability we are allowed to speak of. For instance, we aren’t allowed to work with probabilities defined on all real numbers. But for the majority of our purposes on this blog, this treatment will be enough. Indeed, most programming applications restrict infinite problems to finite subproblems or approximations (although in their analysis we often appeal to the infinite).

So let us begin with probability spaces and random variables.

Finite Probability Spaces

We begin by defining probability as a set with an associated function. The intuitive idea is that the set consists of the outcomes of some experiment, and the function gives the probability of each event happening. For example, a set might represent heads and tails outcomes of a coin flip, while the function assigns a probability of one half (or some other numbers) to the outcomes. As usual, this is just intuition and not rigorous mathematics. And so the following definition will lay out the necessary condition for this probability to make sense.

Definition: A finite set equipped with a function is a probability space if the function satisfies the property

That is, the sum of all the values of must be 1.

Sometimes the set is called the sample space, and the act of choosing an element of according to the probabilities given by is called drawing an example. The function is usually called the probability mass function. Despite being part of our first definition, the probability mass function is relatively useless except to build what follows. Because we don’t really care about the probability of a single outcome as much as we do the probability of an event.

Definition: An event is a subset of a sample space.
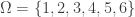
For instance, suppose our probability space is and is defined by setting for all (here the “experiment” is rolling a single die). Then we are likely interested in more exquisite kinds of outcomes; instead of asking the probability that the outcome is 4, we might ask what is the probability that the outcome is even? This event would be the subset , and if any of these are the outcome of the experiment, the event is said to occur. In this case we would expect the probability of the die roll being even to be 1/2 (but we have not yet formalized why this is the case).

As a quick exercise, the reader should formulate a two-dice experiment in terms of sets. What would the probability space consist of as a set? What would the probability mass function look like? What are some interesting events one might consider (if playing a game of craps)?

Of course, we want to extend the probability mass function (which is only defined on single outcomes) to all possible events of our probability space. That is, we want to define a probability measure, where denotes the set of all subsets of . The example of a die roll guides our intuition: the probability of any event should be the sum of the probabilities of the outcomes contained in it. i.e. we define

where by convention the empty sum has value zero. Note that the function is often denoted .

So for example, the coin flip experiment can’t have zero probability for both of the two outcomes 0 and 1; the sum of the probabilities of all events must sum to 1. More coherently: by the defining property of a probability space. And so if there are only two outcomes of the experiment, then they must have probabilities and for some . Such a probability space is often called a Bernoulli trial.

Now that the function is defined on all events, we can simplify our notation considerably. Because the probability mass function uniquely determines and because contains all information about in it (), we may speak of as the probability measure of , and leave out of the picture. Of course, when we define a probability measure, we will allow ourselves to just define the probability mass function and the definition of is understood as above.

There are some other quick properties we can state or prove about probability measures: by convention, if are disjoint then , and if then . The proofs of these facts are trivial, but a good exercise for the uncomfortable reader to work out.

Random Variables

The next definition is crucial to the entire theory. In general, we want to investigate many different kinds of random quantities on the same probability space. For instance, suppose we have the experiment of rolling two dice. The probability space would be

Where the probability measure is defined uniformly by setting all single outcomes to have probability 1/36. Now this probability space is very general, but rarely are we interested only in its events. If this probability space were interpreted as part of a game of craps, we would likely be more interested in the sum of the two dice than the actual numbers on the dice. In fact, we are really more interested in the payoff determined by our roll.

Sums of numbers on dice are certainly predictable, but a payoff can conceivably be any function of the outcomes. In particular, it should be a function of because all of the randomness inherent in the game comes from the generation of an output in (otherwise we would define a different probability space to begin with).

And of course, we can compare these two different quantities (the amount of money and the sum of the two dice) within the framework of the same probability space. This “quantity” we speak of goes by the name of a random variable.

Definition: random variable  is a real-valued function on the sample space .

So for example the random variable for the sum of the two dice would be . We will slowly phase out the function notation as we go, reverting to it when we need to avoid ambiguity.

We can further define the set of all random variables . It is important to note that this forms a vector space. For those readers unfamiliar with linear algebra, the salient fact is that we can add two random variables together and multiply them by arbitrary constants, and the result is another random variable. That is, if are two random variables, so is for real numbers . This function operates linearly, in the sense that its value is . We will use this property quite heavily, because in most applications the analysis of a random variable begins by decomposing it into a combination of simpler random variables.

Of course, there are plenty of other things one can do to functions. For example, is the product of two random variables (defined by ) and one can imagine such awkward constructions as or . We will see in a bit why it these last two aren’t often used (it is difficult to say anything about them).

The simplest possible kind of random variable is one which identifies events as either occurring or not. That is, for an event , we can define a random variable which is 0 or 1 depending on whether the input is a member of . That is,

Definition: An indicator random variable is defined by setting when and 0 otherwise. A common abuse of notation for singleton sets is to denote by .

This is what we intuitively do when we compute probabilities: to get a ten when rolling two dice, one can either get a six, a five, or a four on the first die, and then the second die must match it to add to ten.

The most important thing about breaking up random variables into simpler random variables will make itself clear when we see that expected value is a linear functional. That is, probabilistic computations of linear combinations of random variables can be computed by finding the values of the simpler pieces. We can’t yet make that rigorous though, because we don’t yet know what it means to speak of the probability of a random variable’s outcome.

Definition: Denote by the set of outcomes for which . With the function notation, .

This definition extends to constructing ranges of outcomes of a random variable. i.e., we can define or just as we would naively construct sets. It works in general for any subset of . The notation is , and we will also call these sets events. The notation becomes useful and elegant when we combine it with the probability measure . That is, we want to write things like and read it in our head “the probability that is even”.

This is made rigorous by simply setting

In words, it is just the sum of the probabilities that individual outcomes will have a value under that lands in . We will also use for the shorthand notation or .

Often times will be smaller than itself, even if is large. For instance, let the probability space be the set of possible lottery numbers for one week’s draw of the lottery (with uniform probabilities), let be the profit function. Then is very small indeed.

We should also note that because our probability spaces are finite, the image of the random variable is a finite subset of real numbers. In other words, the set of all events of the form where form a partition of . As such, we get the following immediate identity:

The set of such events is called the probability distribution of the random variable .

The final definition we will give in this section is that of independence. There are two separate but nearly identical notions of independence here. The first is that of two events. We say that two events are independent if the probability of both occurring is the product of the probabilities of each event occurring. That is, . There are multiple ways to realize this formally, but without the aid of conditional probability (more on that next time) this is the easiest way. One should note that this is distinct from being disjoint as sets, because there may be a zero-probability outcome in both sets.

The second notion of independence is that of random variables. The definition is the same idea, but implemented using events of random variables instead of regular events. In particular, are independent random variables if

for all .

Expectation

We now turn to notions of expected value and variation, which form the cornerstone of the applications of probability theory.

Definition: Let be a random variable on a finite probability space . The expected value of , denoted , is the quantity

Note that if we label the image of by then this is equivalent to

The most important fact about expectation is that it is a linear functional on random variables. That is,

Theorem: If are random variables on a finite probability space and , then

Proof. The only real step in the proof is to note that for each possible pair of values in the images of resp., the events form a partition of the sample space . That is, because has a constant value on , the second definition of expected value gives

and a little bit of algebraic elbow grease reduces this expression to . We leave this as an exercise to the reader, with the additional note that the sum is identical to .

If we additionally know that are independent random variables, then the same technique used above allows one to say something about the expectation of the product  (again by definition, ). In this case . We leave the proof as an exercise to the reader.

Now intuitively the expected value of a random variable is the “center” of the values assumed by the random variable. It is important, however, to note that the expected value need not be a value assumed by the random variable itself; that is, it might not be true that . For instance, in an experiment where we pick a number uniformly at random between 1 and 4 (the random variable is the identity function), the expected value would be:

But the random variable never achieves this value. Nevertheless, it would not make intuitive sense to call either 2 or 3 the “center” of the random variable (for both 2 and 3, there are two outcomes on one side and one on the other).

Let’s see a nice application of the linearity of expectation to a purely mathematical problem. The power of this example lies in the method: after a shrewd decomposition of a random variable into simpler (usually indicator) random variables, the computation of becomes trivial.

tournament  is a directed graph in which every pair of distinct vertices has exactly one edge between them (going one direction or the other). We can ask whether such a graph has a Hamiltonian path, that is, a path through the graph which visits each vertex exactly once. The datum of such a path is a list of numbers , where we visit vertex at stage of the traversal. The condition for this to be a valid Hamiltonian path is that is an edge in for all .

Now if we construct a tournament on vertices by choosing the direction of each edges independently with equal probability 1/2, then we have a very nice probability space and we can ask what is the expected number of Hamiltonian paths. That is, is the random variable giving the number of Hamiltonian paths in such a randomly generated tournament, and we are interested in .

To compute this, simply note that we can break , where ranges over all possible lists of the vertices. Then , and it suffices to compute the number of possible paths and the expected value of any given path. It isn’t hard to see the number of paths is as this is the number of possible lists of items. Because each edge direction is chosen with probability 1/2 and they are all chosen independently of one another, the probability that any given path forms a Hamiltonian path depends on whether each edge was chosen with the correct orientation. That’s just

which by independence is

That is, the expected number of Hamiltonian paths is .

Variance and Covariance

Just as expectation is a measure of center, variance is a measure of spread. That is, variance measures how thinly distributed the values of a random variable are throughout the real line.

Definition: The variance of a random variable is the quantity .

That is, is a number, and so is the random variable defined by $latex . It is the expectation of the square of the deviation of from its expected value.

One often denotes the variance by or . The square is for silly reasons: the standard deviation, denoted and equivalent to has the same “units” as the outcomes of the experiment and so it’s preferred as the “base” frame of reference by some. We won’t bother with such physical nonsense here, but we will have to deal with the notation.

The variance operator has a few properties that make it quite different from expectation, but nonetheless fall our directly from the definition. We encourage the reader to prove a few:

In addition, the quantity is more complicated than one might first expect. In fact, to fully understand this quantity one must create a notion of correlation between two random variables. The formal name for this is covariance.

Definition: Let be random variables. The covariance of and , denoted , is the quantity .

Note the similarities between the variance definition and this one: if then the two quantities coincide. That is, .

There is a nice interpretation to covariance that should accompany every treatment of probability: it measures the extent to which one random variable “follows” another. To make this rigorous, we need to derive a special property of the covariance.

Theorem: Let be random variables with variances . Then their covariance is at most the product of the standard deviations in magnitude:

Proof. Take any two non-constant random variables and (we will replace these later with ). Construct a new random variable where is a real variable and inspect its expected value. Because the function is squared, its values are all nonnegative, and hence its expected value is nonnegative. That is, . Expanding this and using linearity gives

This is a quadratic function of a single variable which is nonnegative. From elementary algebra this means the discriminant is at most zero. i.e.

and so dividing by 4 and replacing with , resp., gives

and the result follows.

Note that equality holds in the discriminant formula precisely when (the discriminant is zero), and after the replacement this translates to for some fixed value of . In other words, for some real numbers we have .

This has important consequences even in English: the covariance is maximized when is a linear function of , and otherwise is bounded from above and below. By dividing both sides of the inequality by we get the following definition:

Definition: The Pearson correlation coefficient of two random variables is defined by

If is close to 1, we call and  positively correlated. If is close to -1 we call them negatively correlated, and if is close to zero we call them uncorrelated.

The idea is that if two random variables are positively correlated, then a higher value for one variable (with respect to its expected value) corresponds to a higher value for the other. Likewise, negatively correlated variables have an inverse correspondence: a higher value for one correlates to a lower value for the other. The picture is as follows:

The  horizontal axis plots a sample of values of the random variable and the vertical plots a sample of . The linear correspondence is clear. Of course, all of this must be taken with a grain of salt: this correlation coefficient is only appropriate for analyzing random variables which have a linear correlation. There are plenty of interesting examples of random variables with non-linear correlation, and the Pearson correlation coefficient fails miserably at detecting them.

Here are some more examples of Pearson correlation coefficients applied to samples drawn from the sample spaces of various (continuous, but the issue still applies to the finite case) probability distributions:

Various examples of the Pearson correlation coefficient, credit Wikipedia.

Though we will not discuss it here, there is still a nice precedent for using the Pearson correlation coefficient. In one sense, the closer that the correlation coefficient is to 1, the better a linear predictor will perform in “guessing” values of given values of (same goes for -1, but the predictor has negative slope).

But this strays a bit far from our original point: we still want to find a formula for . Expanding the definition, it is not hard to see that this amounts to the following proposition:

Proposition: The variance operator satisfies

And using induction we get a general formula:

Note that in the general sum, we get a bunch of terms .

Another way to look at the linear relationships between a collection of random variables is via a covariance matrix.

Definition: The covariance matrix of a collection of random variables is the matrix whose entry is .

As we have already seen on this blog in our post on eigenfaces, one can manipulate this matrix in interesting ways. In particular (and we may be busting out an unhealthy dose of new terminology here), the covariance matrix is symmetric and nonnegative, and so by the spectral theorem it has an orthonormal basis of eigenvectors, which allows us to diagonalize it. In more direct words: we can form a new collection of random variables (which are linear combinations of the original variables ) such that the covariance of distinct pairs are all zero. In one sense, this is the “best perspective” with which to analyze the random variables. We gave a general algorithm to do this in our program gallery, and the technique is called principal component analysis.

Next Up

So far in this primer we’ve seen a good chunk of the kinds of theorems one can prove in probability theory. Fortunately, much of what we’ve said for finite probability spaces holds for infinite (discrete) probability spaces and has natural analogues for continuous probability spaces.

Next time, we’ll investigate how things change for discrete probability spaces, and should we need it, we’ll follow that up with a primer on continuous probability. This will get our toes wet with some basic measure theory, but as every mathematician knows: analysis builds character.

Until then!

Like this:

One blogger likes this.

The Crisis of the Middle Class and American Power | Stratfor

$
0
0

Comments:"The Crisis of the Middle Class and American Power | Stratfor"

URL:http://www.stratfor.com/weekly/crisis-middle-class-and-american-power


By George Friedman
Founder and Chief Executive Officer

Last week I wrote about the crisis of unemployment in Europe. I received a great deal of feedback, with Europeans agreeing that this is the core problem and Americans arguing that the United States has the same problem, asserting that U.S. unemployment is twice as high as the government's official unemployment rate. My counterargument is that unemployment in the United States is not a problem in the same sense that it is in Europe because it does not pose a geopolitical threat. The United States does not face political disintegration from unemployment, whatever the number is. Europe might.

At the same time, I would agree that the United States faces a potentially significant but longer-term geopolitical problem deriving from economic trends. The threat to the United States is the persistent decline in the middle class' standard of living, a problem that is reshaping the social order that has been in place since World War II and that, if it continues, poses a threat to American power.

The Crisis of the American Middle Class

The median household income of Americans in 2011 was $49,103. Adjusted for inflation, the median income is just below what it was in 1989 and is $4,000 less than it was in 2000. Take-home income is a bit less than $40,000 when Social Security and state and federal taxes are included. That means a monthly income, per household, of about $3,300. It is urgent to bear in mind that half of all American households earn less than this. It is also vital to consider not the difference between 1990 and 2011, but the difference between the 1950s and 1960s and the 21st century. This is where the difference in the meaning of middle class becomes most apparent.

In the 1950s and 1960s, the median income allowed you to live with a single earner -- normally the husband, with the wife typically working as homemaker -- and roughly three children. It permitted the purchase of modest tract housing, one late model car and an older one. It allowed a driving vacation somewhere and, with care, some savings as well. I know this because my family was lower-middle class, and this is how we lived, and I know many others in my generation who had the same background. It was not an easy life and many luxuries were denied us, but it wasn't a bad life at all.

Someone earning the median income today might just pull this off, but it wouldn't be easy. Assuming that he did not have college loans to pay off but did have two car loans to pay totaling $700 a month, and that he could buy food, clothing and cover his utilities for $1,200 a month, he would have $1,400 a month for mortgage, real estate taxes and insurance, plus some funds for fixing the air conditioner and dishwasher. At a 5 percent mortgage rate, that would allow him to buy a house in the $200,000 range. He would get a refund back on his taxes from deductions but that would go to pay credit card bills he had from Christmas presents and emergencies. It could be done, but not easily and with great difficulty in major metropolitan areas. And if his employer didn't cover health insurance, that $4,000-5,000 for three or four people would severely limit his expenses. And of course, he would have to have $20,000-40,000 for a down payment and closing costs on his home. There would be little else left over for a week at the seashore with the kids.

And this is for the median. Those below him -- half of all households -- would be shut out of what is considered middle-class life, with the house, the car and the other associated amenities. Those amenities shift upward on the scale for people with at least $70,000 in income. The basics might be available at the median level, given favorable individual circumstance, but below that life becomes surprisingly meager, even in the range of the middle class and certainly what used to be called the lower-middle class.

The Expectation of Upward Mobility

I should pause and mention that this was one of the fundamental causes of the 2007-2008 subprime lending crisis. People below the median took out loans with deferred interest with the expectation that their incomes would continue the rise that was traditional since World War II. The caricature of the borrower as irresponsible misses the point. The expectation of rising real incomes was built into the American culture, and many assumed based on that that the rise would resume in five years. When it didn't they were trapped, but given history, they were not making an irresponsible assumption.

American history was always filled with the assumption that upward mobility was possible. The Midwest and West opened land that could be exploited, and the massive industrialization in the late 19th and early 20th centuries opened opportunities. There was a systemic expectation of upward mobility built into American culture and reality.

The Great Depression was a shock to the system, and it wasn't solved by the New Deal, nor even by World War II alone. The next drive for upward mobility came from post-war programs for veterans, of whom there were more than 10 million. These programs were instrumental in creating post-industrial America, by creating a class of suburban professionals. There were three programs that were critical:

The GI Bill, which allowed veterans to go to college after the war, becoming professionals frequently several notches above their parents. The part of the GI Bill that provided federally guaranteed mortgages to veterans, allowing low and no down payment mortgages and low interest rates to graduates of publicly funded universities. The federally funded Interstate Highway System, which made access to land close to but outside of cities easier, enabling both the dispersal of populations on inexpensive land (which made single-family houses possible) and, later, the dispersal of business to the suburbs.

There were undoubtedly many other things that contributed to this, but these three not only reshaped America but also created a new dimension to the upward mobility that was built into American life from the beginning. Moreover, these programs were all directed toward veterans, to whom it was acknowledged a debt was due, or were created for military reasons (the Interstate Highway System was funded to enable the rapid movement of troops from coast to coast, which during World War II was found to be impossible). As a result, there was consensus around the moral propriety of the programs.

The subprime fiasco was rooted in the failure to understand that the foundations of middle class life were not under temporary pressure but something more fundamental. Where a single earner could support a middle class family in the generation after World War II, it now took at least two earners. That meant that the rise of the double-income family corresponded with the decline of the middle class. The lower you go on the income scale, the more likely you are to be a single mother. That shift away from social pressure for two parent homes was certainly part of the problem.

Re-engineering the Corporation

But there was, I think, the crisis of the modern corporation. Corporations provided long-term employment to the middle class. It was not unusual to spend your entire life working for one. Working for a corporation, you received yearly pay increases, either as a union or non-union worker. The middle class had both job security and rising income, along with retirement and other benefits. Over the course of time, the culture of the corporation diverged from the realities, as corporate productivity lagged behind costs and the corporations became more and more dysfunctional and ultimately unsupportable. In addition, the corporations ceased focusing on doing one thing well and instead became conglomerates, with a management frequently unable to keep up with the complexity of multiple lines of business.

For these and many other reasons, the corporation became increasingly inefficient, and in the terms of the 1980s, they had to be re-engineered -- which meant taken apart, pared down, refined and refocused. And the re-engineering of the corporation, designed to make them agile, meant that there was a permanent revolution in business. Everything was being reinvented. Huge amounts of money, managed by people whose specialty was re-engineering companies, were deployed. The choice was between total failure and radical change. From the point of view of the individual worker, this frequently meant the same thing: unemployment. From the view of the economy, it meant the creation of value whether through breaking up companies, closing some of them or sending jobs overseas. It was designed to increase the total efficiency, and it worked for the most part.

This is where the disjuncture occurred. From the point of view of the investor, they had saved the corporation from total meltdown by redesigning it. From the point of view of the workers, some retained the jobs that they would have lost, while others lost the jobs they would have lost anyway. But the important thing is not the subjective bitterness of those who lost their jobs, but something more complex.

As the permanent corporate jobs declined, more people were starting over. Some of them were starting over every few years as the agile corporation grew more efficient and needed fewer employees. That meant that if they got new jobs it would not be at the munificent corporate pay rate but at near entry-level rates in the small companies that were now the growth engine. As these companies failed, were bought or shifted direction, they would lose their jobs and start over again. Wages didn't rise for them and for long periods they might be unemployed, never to get a job again in their now obsolete fields, and certainly not working at a company for the next 20 years.

The restructuring of inefficient companies did create substantial value, but that value did not flow to the now laid-off workers. Some might flow to the remaining workers, but much of it went to the engineers who restructured the companies and the investors they represented. Statistics reveal that, since 1947 (when the data was first compiled), corporate profits as a percentage of gross domestic product are now at their highest level, while wages as a percentage of GDP are now at their lowest level. It was not a question of making the economy more efficient -- it did do that -- it was a question of where the value accumulated. The upper segment of the wage curve and the investors continued to make money. The middle class divided into a segment that entered the upper-middle class, while another faction sank into the lower-middle class.

American society on the whole was never egalitarian. It always accepted that there would be substantial differences in wages and wealth. Indeed, progress was in some ways driven by a desire to emulate the wealthy. There was also the expectation that while others received far more, the entire wealth structure would rise in tandem. It was also understood that, because of skill or luck, others would lose.

What we are facing now is a structural shift, in which the middle class' center, not because of laziness or stupidity, is shifting downward in terms of standard of living. It is a structural shift that is rooted in social change (the breakdown of the conventional family) and economic change (the decline of traditional corporations and the creation of corporate agility that places individual workers at a massive disadvantage).

The inherent crisis rests in an increasingly efficient economy and a population that can't consume what is produced because it can't afford the products. This has happened numerous times in history, but the United States, excepting the Great Depression, was the counterexample.

Obviously, this is a massive political debate, save that political debates identify problems without clarifying them. In political debates, someone must be blamed. In reality, these processes are beyond even the government's ability to control. On one hand, the traditional corporation was beneficial to the workers until it collapsed under the burden of its costs. On the other hand, the efficiencies created threaten to undermine consumption by weakening the effective demand among half of society.

The Long-Term Threat

The greatest danger is one that will not be faced for decades but that is lurking out there. The United States was built on the assumption that a rising tide lifts all ships. That has not been the case for the past generation, and there is no indication that this socio-economic reality will change any time soon. That means that a core assumption is at risk. The problem is that social stability has been built around this assumption -- not on the assumption that everyone is owed a living, but the assumption that on the whole, all benefit from growing productivity and efficiency.

If we move to a system where half of the country is either stagnant or losing ground while the other half is surging, the social fabric of the United States is at risk, and with it the massive global power the United States has accumulated. Other superpowers such as Britain or Rome did not have the idea of a perpetually improving condition of the middle class as a core value. The United States does. If it loses that, it loses one of the pillars of its geopolitical power.

The left would argue that the solution is for laws to transfer wealth from the rich to the middle class. That would increase consumption but, depending on the scope, would threaten the amount of capital available to investment by the transfer itself and by eliminating incentives to invest. You can't invest what you don't have, and you won't accept the risk of investment if the payoff is transferred away from you.

The agility of the American corporation is critical. The right will argue that allowing the free market to function will fix the problem. The free market doesn't guarantee social outcomes, merely economic ones. In other words, it may give more efficiency on the whole and grow the economy as a whole, but by itself it doesn't guarantee how wealth is distributed. The left cannot be indifferent to the historical consequences of extreme redistribution of wealth. The right cannot be indifferent to the political consequences of a middle-class life undermined, nor can it be indifferent to half the population's inability to buy the products and services that businesses sell.

The most significant actions made by governments tend to be unintentional. The GI Bill was designed to limit unemployment among returning serviceman; it inadvertently created a professional class of college graduates. The VA loan was designed to stimulate the construction industry; it created the basis for suburban home ownership. The Interstate Highway System was meant to move troops rapidly in the event of war; it created a new pattern of land use that was suburbia.

It is unclear how the private sector can deal with the problem of pressure on the middle class. Government programs frequently fail to fulfill even minimal intentions while squandering scarce resources. The United States has been a fortunate country, with solutions frequently emerging in unexpected ways.

It would seem to me that unless the United States gets lucky again, its global dominance is in jeopardy. Considering its history, the United States can expect to get lucky again, but it usually gets lucky when it is frightened. And at this point it isn't frightened but angry, believing that if only its own solutions were employed, this problem and all others would go away. I am arguing that the conventional solutions offered by all sides do not yet grasp the magnitude of the problem -- that the foundation of American society is at risk -- and therefore all sides are content to repeat what has been said before.

People who are smarter and luckier than I am will have to craft the solution. I am simply pointing out the potential consequences of the problem and the inadequacy of all the ideas I have seen so far.

AIG considers suing government for bailing it out, world implodes in on itself

$
0
0

Comments:"AIG considers suing government for bailing it out, world implodes in on itself"

URL:http://www.washingtonpost.com/blogs/wonkblog/wp/2013/01/08/aig-considers-suing-government-for-bailing-it-out-world-implodes-in-on-itself/


Fresh from launching a branding campaign to try to rechristen itself as a paragon of patriotism, the giant insurer American International Group is reportedly weighing a step that would remind America just why everyone got so darn mad in the first place.

The board of AIG, according to the New York Times, is weighing whether to join a $25 billion lawsuit against the U.S. government for forcing unacceptably high losses on shareholders in its bailout. The argument is that this violated the Fifth Amendment’s prohibition on the government seizing private property without just compensation.

To anyone who closely followed the events of September 2008, when AIG was bailed out, this theory seems patently ridiculous. Here’s a refresher on what happened. The company’s financial products division had been, in effect, selling guarantees against losses on highly rated securities tied to mortgages. When those securities plummeted in value, the losses in that division were so great that it brought one of the world’s biggest financial firms to the brink of bankruptcy. When AIG executives turned to the government for help on Sept. 16, 2008, the day after Lehman Brothers went bankrupt, they had no other options; no private entity would lend them money.

It is true that AIG executives wanted a sweeter deal than they got. They envisioned getting access to emergency Fed lending at some reasonably low interest rate, a privilege granted to banks (and also one of the reasons banks are intensively regulated). New York Fed president Tim Geithner and Treasury Secretary Hank Paulson had other ideas. If the government was going to bail the company out, they were going to insist on more punitive terms. The initial bailout was a loan of up $85 billion at an interest rate of Libor (the short-term bank lending rate) plus 8.5 percentage points. And in exchange for getting the lending facility at all, the New York Fed took on 79.9 percent of the company’s stock. The bailout would eventually expand to $182 billion and a 92 percent government stake in AIG.

The message the government was sending with the onerous terms was clear: If you run a company into the ground, and have to come to Uncle Sam for help, we will help you only reluctantly and at a high cost. If you don’t like it, well, you can join Lehman Brothers in bankruptcy court.

According to the Times report, the AIG board will hear presentations Wednesday from Starr International, the company leading the lawsuit led by former AIG chief executive Hank Greenberg, arguing that AIG should join the suit, then from lawyers for the Treasury and New York Fed. Presumably the government lawyers will offer more precise, legalistic answers to Greenberg’s claims than the head-smacking sense of disbelief that has accompanied public disclosure of the news.

It would be a particularly interesting time to be a fly on the wall in the office of Fed Chairman Ben Bernanke. The AIG bailout was one of the few things that seemed to rile the preternaturally calm academic. “Of all the events and all of the things we’ve done in the last 18 months,” he told “60 Minutes” in March 2009, “the single one that makes me the angriest, that gives me the most angst, is the intervention with AIG. Here was a company that made all kinds of unconscionable bets. Then, when those bets went wrong,  we had a situation where the failure of that company would have brought down the financial system. . . . . It makes me angry. I slammed the phone more than a few times on discussing AIG. It’s– it’s just absolutely– I understand why the American people are angry. It’s absolutely unfair that taxpayer dollars are going to prop up a company that made these terrible bets–that was operating out of the sight of regulators, but which we have no choice but to stabilize, or else risk enormous impact, not just in the financial system, but on the whole U.S. economy.”

If AIG goes forward with joining the suit against the government, it’s easy to imagine that Bernanke’s blood pressure will rise all the more. His won’t be the only one.

All Dashboards Should be Feeds - Anil Dash

$
0
0

Comments:"All Dashboards Should be Feeds - Anil Dash"

URL:http://dashes.com/anil/2013/01/all-dashboards-should-be-feeds.html


Last week, we announced the new beta release of ThinkUp (if you're a geek or developer, try it out!) and one of the reasons I was most excited to talk about the new release is because it has a whole new user experience which exemplifies a belief about analytics that I've become pretty adamant about.

Every time an app provides a dashboard full of charts and graphs, it should be replaced with a news feed offering a stream of insights instead.

There are lots and lots of apps that provide a dashboard of analytics these days. From Google Analytics to Chartbeat to Facebook's Insights tool, there are all kinds of dashboard displays that we end up staring at while trying to manage a presence online. And they all share a consistent problem: It's hard to tell what the hell is going on.

Beautiful but Empty

When I talk about "dashboards" here, I don't mean ones that are already a news feed or stream of posts, like Tumblr, but the old-fashioned kind where you see a bunch of meters and dials and line charts that are supposed to communicate the current status of whatever you're tracking. You can see Chartbeat's beautiful set of graphs and charts above, and Facebook's got a fancy one for insights on their platform; It looks like this:

And you know what? I have no idea whether my numbers on those services are good or not. I don't know what I'm supposed to do about them. In fact, though I love Chartbeat, the information that I get from them that means the most is their push notifications on my phone which tell me when my site is over its maximum monthly number of visitors. That is meaningful.

Insights like exceeding my usual level of visitors, or achieving some threshold I'd never crossed before, or doing some task particularly efficiently would be meaningful markers that I could respond to intelligently.

Worse, trying to make sense of a gauge on a dashboard essentially requires me to keep three bits of data in my mind:

  • What metric or measure a particular meter is reporting
  • The last time I looked at that meter
  • What the value of the meter was the last time I looked at it

That's a lot! For more esoteric points, it's downright impossible, so I'm left squinting at a little chart, trying to deduce its meaning. Or, on the other extreme, I get something like the line chart that shows my number of Twitter followers. That line only ever goes up and to the right. Sometimes it goes up more than others, but even that's generally impossible to discern.

A Better Meter

We had precisely these issues with ThinkUp in version 1. Lots of little line graphs and pie charts that either rarely changed, or that changed regularly but with no explanation of the meaning of those changes or recommendations of what to do as a result.

And just getting to that stage was hard! The community put a ton of effort into collecting useful data, and presenting it appropriately. But all of that hard work still left an average user of the app squinting at some inscrutable charts, ultimately unsatisfied.

So we killed the whole dashboard. And replaced it with a simple stream. Here's a live example of the White House's social data, from a very early development version of ThinkUp 2.0. Now, not all of the data here are presented in a very compelling way yet, and of course we're still working to shed our old implementation of basic charts and graphs to move into a stream that does much more to coach you about what you should be doing online.

Take the idea of your follower count. ThinkUp used to offer a pretty standard inscrutable little line chart showing your number of followers going up over time. But now, there's a stream with a couple of items in it that look like this (these aren't the final UI, just a work in progress):

That offers a bit more analysis, showing a forward-looking extrapolation of when the @whitehouse account will reach a certain number of followers. If someone sees that as a useful goal, they now have much more info than they would have had from a chart showing their past history of growth.

Then we can break down that data even further and tease out the meaning by determining which of these followers are notable for being popular or discerning enough that they should be called out or paid attention to. That looks like this:

And this isn't to say that traditional charts or graphs don't have a place in communicating information in this stream. But what we've done is put them behind disclosure buttons (again these are just a first prototype of the UI for such a thing) and made it possible to reveal the details behind an item, whether that's a detailed chart or just a full list of people to pay attention to.

Similarly, you can see an expanded version of the "interesting new followers" insight in the ThinkUp demo for the White House as well.

Even with just a rough version of our new stream built out, I immediately realized that this was a fundamentally better way to quickly consume this analytics data and be able to make decisions or act on it. There were also many other benefits to radically simplifying the user interface — I only see data now when it changes in a significant way, so I don't have to go digging around a bunch of different screens trying to deduce if something has changed and whether the change is meaningful.

This has really quickly ruined me for every other stats app that I use. Chartbeat is awesome for being real-time, but it'd be so much more compelling if it were a real-time stream or Twitter-style feed of information about how my site and my content's doing, with the ability to drill down into individual insights about my site. Google Analytics has always been totally inscrutable to me, but if it just bubbled up particularly meaningful tidbits about my site or its stats I can imagine being able to actually make educated decisions about what I do here. As it stands, I haven't had any reason to go into Google Analytics in ages.

So, a big but sincere request to everybody who's making analytics or stats apps, either standalone or as part of a larger app: Please throw away the dashboard. I know they demo well and look great in investor pitch decks or screencast videos. But they don't actually help me make decisions, or get better at what I'm doing. And that's the only reason I'm measuring something in the first place.

Related Reading

If you liked this (or hated it), you should also read Stop Publishing Web Pages, about the move from static web pages to streams that are part of app-style experiences. It's in the same vein.

Public domain: Access denied | The Economist

$
0
0

Comments:"Public domain: Access denied | The Economist"

URL:http://www.economist.com/blogs/babbage/2013/01/public-domain


Jan 10th 2013, 20:39 by G.F. | SEATTLE

ON JANUARY 1st each year the Centre for the Study of the Public Domain at Duke University fetes Public Domain Day. It is a joyous occasion, celebrating the end of copyright protection for works that at long last leave the bosom of legal monopoly for the commonweal. The centre does, however, temper the elation with an important caveat: while much of the rest of the world may take cheer from mass migration of material to the public domain each year, America has not seen one since the 1970s, nor will it until 2019.

The public domain is a catch-all term for material outside of the strictures of reproductive limits, or for which rights were formally foresworn. The centre promotes a balance between a creator's and the public's interest, says Duke's James Boyle. Mr Boyle, one of the drafters of the set of liberal copyright assignment licences known as Creative Commons, invokes countless studies arguing that tight copyright makes sense over short periods, to encourage creative endeavour, but can be counterproductive if extended too far. Yet rightsholders lobby for greater control (and legislators often oblige them) "even when it turns out that it hurts their interest," says Mr Boyle.

Europe has much to shout about each January 1st because unlike America, its harmonised copyright laws sever the licensing bonds on the January 1st that follows the 70th anniversary of an author's death. Indeed, Public Domain Day was launched as part of the European Union's Communia project concerned with related policy issues. As a result, this year Europeans, and readers in a number of other places, will be able freely to enjoy remarkable works, such as "The Confusions of Cadet Törless" and "The Man without Qualities" by the Austrian author Robert Musil, as well as the allegorical, surrealist oeuvre of Bruno Schulz, a Pole murdered by the Nazis in 1942, including "The Street of Crocodiles" and "The Cinnamon Shops". (The removal of restrictions applies to the originally published editions in the author's native language, not translations, or even, in some cases, later amended versions.)

America chose a different path. In 1978 and 1998 Congress extended, reshaped and expanded copyright durations and the scope of copyright for existing and future works (see Peter Hirtle's authoritative website for the gory details). For new works produced after January 1st 1978, the period of protection is the same as in the EU. But for works published from 1923 to 1977 for which copyright was properly registered and renewed (as applicable in the period when originally registered or created), copyright was prolonged to a full 75 years from publication regardless of the author's presence among the living. (Work by employees for a company or for which copyright has been entirely assigned to a firm, so-called "work for hire", has a different set of rules.)

In 1998 this was extended to 95 years, partly thanks to lobbying efforts by Disney. It wanted to prevent the first Mickey Mouse film, "Steamboat Willie", from entering the public domain. According to the old rules, the animation, released in 1928, would have been free to reproduce, modify and sell on January 1st 2004. Disney is a conspicuous and prolific user of the public domain, Mr Boyle notes, while remaining one of the most ardent defenders of keeping its own material out of it. 

Mr Boyle says the 95-year rule applied to older works made little sense. If copyright is assigned, in keeping with the American constitution, to "promote the progress of science and useful arts", extending it to people who had no expectation of long-term gains (and many of whom were, in fact, dead when the law was passed) would have needed to provide a retrospective incentive to create the works in the first place.

Duke's centre thus uses January 1st to tell Americans what they would be enjoying ready access to were the pre-1978 rules (a term of 28 years renewable in writing for another 28 years) still in place. The list includes volumes by Winston Churchill, Philip K. Dick's "Minority Report", Alfred Hitchcock's 1956 remake of "The Man Who Knew Too Much" and Johnny Cash's composition (though not recordings of) "I Walk the Line".

In 2019 American law will release published works of all kinds registered up until the end of 1923. Unless, that is, the copyright regime changes again. That would not surprise Jennifer Jenkins, who heads the Duke centre. The last extension, the Sonny Bono Act of 1998, met with little dissent (and mostly celebrity testimony). Congress passed the bill unanimously, in part to honour Bono, a fervent defender of Hollywood and the notion of perpetual copyright who had died a few months earlier. That said, Ms Jenkins points to last year's concerted opposition to SOPA and PIPA bills, viewed by many as giving all manner of rightholders too much control, as a sign that the advocates of the public domain will not give up without a fight.

I want the world to scroll this way.

rubytune — rails performance tuning, emergency troubleshooting, server and ops consulting

$
0
0

Comments:"rubytune — rails performance tuning, emergency troubleshooting, server and ops consulting"

URL:http://rubytune.com/cheat


Copy

Process Basics

All processes, with params + hierarchy

Show all ruby-related PIDs and processes

What is a process doing?

What files does a process have open?
(also nice to detect ruby version of a process)

Flavors of kill

Keep an eye on a process

Memory

How much mem is free?
Learn how to read output

List the top 10 memory hogs

Detect OOM and other bad things

Disable OOM killer for a process

Disk/Files

Check reads/writes per disk

Files (often logs) marked for deletion but not yet deleted

Overview of all disks

Usage of this dir and all subdirs

Find files over 100MB

Low hanging fruit for free space.
Check /var/log too!

Find files created within the last 7 days

Find files older than 14 days

Delete files older than 14 days

Monitor a log file for an IP or anything else

Generate a large file (count * bs = total bytes)

Network

TCP sockets in use

Get IP/Ethernet info

host IP resolution

Curl, display headers (I), follow redirects (L)

Traceroute with stats over time (top for traceroute)Requires install

Traceroute using TCP to avoid ICMP blockage

List any IP blocks/rules

Drop any network requests from IP

Show traffic by port

Show all ports listening with process PID

D/L speed test (don't run in prod! :)

Terminal & Screen

Start a screen session as the current user

Join/re-attach to a screen session

Record a terminal session

Playback a recorded terminal session

Tips n Tricks

Run Previous command as root

Change to last working dir

Run something forever

Databases

"Tail" all queries hitting mysql.Learn more
Connect to production mysql locally on port 3307 via sshLearn More

VIRCUREX !!! IMPORTANT !!!

$
0
0

Comments:"VIRCUREX !!! IMPORTANT !!!"

URL:https://bitcointalk.org/index.php?topic=135919.0


Kumala
Sr. Member

Online

Posts: 274

Ignore

Today at 12:19:25 PM

 #1
We sadly need to announce that our wallet has been compromised thus DO NOT send any further funds to any of the coin wallets, BTC, DVC, LTC, etc. We will setup a new wallet and reset all the addresses. This will most likely take the whole weekend.
Logged
Exchange: https://vircurex.com BTC, LTC,DVC Stockexchange: http://www.cryptostocks.com
DVC 6/49 Lottery: https://dvc-lotto.com BTC 6/49 Lottery: https://btc-lotto.com
Earn money browsing the Internet: http://www.profitclicking.com/?r=rwrehp4reyg
Advertisement: No Excuses; no Exchanges; just Fast payouts. FastCash4Bitcoins
stan.distortion
Hero Member

Offline

Posts: 881

Ignore

Today at 12:31:16 PM

 #2

Ouch, good luck with it. Bitcoin central's down too, looks like someone's being a pain in the ass.

Logged

julz: "Susanne Posel's unwitting work in shepherding the dumbest of the dumb away from Bitcoin is a great benefit to the community, for which we should all be grateful."

John (johnthedong)
Global Janitor and
Global Moderator
Hero Member

Offline

Posts: 3173

Ignore

Today at 01:06:40 PM

 #3

Posted an announcement regarding this at Important Announcements subforum.

Logged
My BTC Tip Jar: 1NB1KFnFqnP3WSDZQrWV3pfmph5fWRyadz
My GPG key ID: B3AAEEB0 My OTC ID: johnthedong
Free escrow service available - tips appreciated! (PM Me)
Endgame
Full Member

Offline

Posts: 205

Ignore

Today at 01:25:49 PM

 #4

Sorry to hear that. How bad is the loss? Will users be out of pocket, or can vircurex cover it?

Logged
Kumala
Sr. Member

Online

Posts: 274

Ignore

Today at 01:58:50 PM

 #5
Further update:  The system was not breached, no passwords were compromised (they are salted and multiple times hashed anyways). The attacker used a RubyOnRails vulnerability that was released yesterday (http://www.exploit-db.com/exploits/24019/) to withdraw the funds therefore.
Logged
Exchange: https://vircurex.com BTC, LTC,DVC Stockexchange: http://www.cryptostocks.com
DVC 6/49 Lottery: https://dvc-lotto.com BTC 6/49 Lottery: https://btc-lotto.com
Earn money browsing the Internet: http://www.profitclicking.com/?r=rwrehp4reyg
ripper234
Hero Member

Offline

Posts: 1140


Ron Gross

Ignore

Today at 03:06:08 PM

 #6
Further update:  The system was not breached, no passwords were compromised (they are salted and multiple times hashed anyways). The attacker used a RubyOnRails vulnerability that was released yesterday (http://www.exploit-db.com/exploits/24019/) to withdraw the funds therefore.

Sorry for your lose.

Amm ... the RoR volnurability was posted to multiple large forums, including Slashdot.

Did the attacker see the announcement before you were able to realize it affects you and shut off your systems? How come you missed it for so long that you didn't shut your stuff off / upgrade in time?

Logged
- Blog
- About
- BTCtoX.org - translate between BTC and any other currency.
thebaron
Sr. Member

Offline

Posts: 460


wat

Ignore

Today at 03:10:11 PM

 #7

Exploit released yesterday, eh? How convenient...

Logged
I run http://mail-to-jail.com. I am "thebaron-btc" on Bitcoin-OTC.
Kumala
Sr. Member

Online

Posts: 274

Ignore

Today at 03:14:21 PM

 #8

Before the wild speculations beginn, the service will be recovered and we pay the losses out of our own pockets.

Logged
Exchange: https://vircurex.com BTC, LTC,DVC Stockexchange: http://www.cryptostocks.com
DVC 6/49 Lottery: https://dvc-lotto.com BTC 6/49 Lottery: https://btc-lotto.com
Earn money browsing the Internet: http://www.profitclicking.com/?r=rwrehp4reyg
davout
Staff
Hero Member

Offline

Posts: 2493


1davout

Ignore

Today at 03:36:07 PM

 #9

Ouch, good luck with it. Bitcoin central's down too, looks like someone's being a pain in the ass.

That's just scheduled maintenance
We deployed the fixes within five minutes after receiving the notification from the Rails security mailing list.
Logged
Buy and sell EUR at Bitcoin-Central.net.
Also check-out Instawallet and Instawire, don't need to sign-up to anything!
-- The problem with the French, is that they don't even have a word for entrepreneur
davout
Staff
Hero Member

Offline

Posts: 2493


1davout

Ignore

Today at 03:36:52 PM

 #10

Exploit released yesterday, eh? How convenient...

It's the truth.
Logged
Buy and sell EUR at Bitcoin-Central.net.
Also check-out Instawallet and Instawire, don't need to sign-up to anything!
-- The problem with the French, is that they don't even have a word for entrepreneur
makomk
Hero Member

Online

Posts: 890

Ignore

Today at 03:40:53 PM

 #11

Exploit released yesterday, eh? How convenient...

Bit slow of the attacker. I was actually half-expecting someone to start hacking Bitcoin sites before any exploit was even publicly released.
Logged
Quad XC6SLX150 Board: 860 MHash/s or so.
SIGS ABOUT BUTTERFLY LABS ARE PAID ADS
Kumala
Sr. Member

Online

Posts: 274

Ignore

Today at 05:05:41 PM

 #12
Service restored: deposits, trading and withdrawals are working again

For the time being, some restrictions apply until we have sorted out the account details and validated data integrity.

TradingDepositsWithdrawals
BTCActiveActiveOn hold
NMCActiveActiveOn hold
LTCActiveActiveOn hold
DVCActiveActiveActive
SCActiveActiveOn hold
IXCActiveActiveActive
PPCActiveActiveActive
USDActiveActiveActive
EURActiveActiveActive
Logged
Exchange: https://vircurex.com BTC, LTC,DVC Stockexchange: http://www.cryptostocks.com
DVC 6/49 Lottery: https://dvc-lotto.com BTC 6/49 Lottery: https://btc-lotto.com
Earn money browsing the Internet: http://www.profitclicking.com/?r=rwrehp4reyg
Atruk
Jr. Member

Online

Posts: 61

Ignore

Today at 05:21:42 PM

 #13
Service restored: deposits, trading and withdrawals are working again

For the time being, some restrictions apply until we have sorted out the account details and validated data integrity.

TradingDepositsWithdrawals
BTCActiveActiveOn hold
NMCActiveActiveOn hold
LTCActiveActiveOn hold
DVCActiveActiveActive
SCActiveActiveOn hold
IXCActiveActiveActive
PPCActiveActiveActive
USDActiveActiveActive
EURActiveActiveActive


It's good to see you are recovering so quickly, especially with the severe downtime or outright collapse most exchanges seem to go through.
Logged

1H8Ep63MQ1BPF8uoDUpz2KFhTAzYKqaUE5

davout
Staff
Hero Member

Offline

Posts: 2493


1davout

Ignore

Today at 05:24:34 PM

 #14

Service restored: deposits, trading and withdrawals are working again


Did you switch servers ?
Logged
Buy and sell EUR at Bitcoin-Central.net.
Also check-out Instawallet and Instawire, don't need to sign-up to anything!
-- The problem with the French, is that they don't even have a word for entrepreneur
Kumala
Sr. Member

Online

Posts: 274

Ignore

Today at 05:58:42 PM

 #15
It's been a couple of stressful hours here.

No we did not switch servers, we:
 - applied the Ruby Rails patch
 - backed up all log files for further analysis
 - log files show the XML code injection, we validated all triggered commands to ensure nothing other than withdrawing funds (e.g. backdoor) was done.
 
2AM here, will need to catch some sleep,  mistakes are easily made when being too tired.

Logged
Exchange: https://vircurex.com BTC, LTC,DVC Stockexchange: http://www.cryptostocks.com
DVC 6/49 Lottery: https://dvc-lotto.com BTC 6/49 Lottery: https://btc-lotto.com
Earn money browsing the Internet: http://www.profitclicking.com/?r=rwrehp4reyg
mc_lovin
Hero Member

Offline

Posts: 1835


www.bitcointrading.com

Ignore

Today at 06:38:45 PM

 #16
Total value lost in the heist?

Sorry for your loss indeed.  Sucks that the vulnerability was in rails and not in your app. 

Logged
kiba
Hero Member

Online

Posts: 5580

Ignore

Today at 07:28:24 PM

 #17

DId you hold ALL your money in cold wallets?

Logged
honest bob
Hero Member

Offline

Posts: 1177

Ignore

Today at 08:32:53 PM

 #18

I'm not sure if I feel worse for bitcoin, vicurex, the people with funds there, or ruby on rails.

Logged
TorGuard VPN: Don't get caught using Bittorrent! Spend your bitcoins on a topnotch VPN/Proxy service! I'm renewing my subscription again later this year.

How to implement an algorithm from a scientific paper | Code Capsule

$
0
0

Comments:"How to implement an algorithm from a scientific paper | Code Capsule"

URL:http://codecapsule.com/2012/01/18/how-to-implement-a-paper/


This article is a short guide to implementing an algorithm from a scientific paper. I have implemented many complex algorithms from books and scientific publications, and this article sums up what I have learned while searching, reading, coding and debugging. This is obviously limited to publications in domains related to the field of Computer Science. Nevertheless, you should be able to apply the guidelines and good practices presented below to any kind of paper or implementation.

1 – Before you jump in

There are a few points you should review before you jump into reading a technical paper and implementing it. Make sure you cover them carefully each time you are about to start working on such a project.

1.1 – Find an open source implementation to avoid coding it

Unless you want to implement the paper for the purpose of learning more about the field, you have no need to implement it. Indeed, what you want is not coding the paper, but just the code that implements the paper. So before you start anything, you should spend a couple of days trying to find an open source implementation on the internet. Just think about it: would you rather lose two days looking for the code, or waste two months implementing an algorithm that was already available?

1.2 – Find simpler ways to achieve your goal

Ask yourself what you are trying to do, and if simpler solutions would work for what you need. Could you use another technique – even if the result is only 80% of what you want – that does not require to implement the paper, and that you could get running within the next two days or so with available open source libraries? For more regarding this, see my article The 20 / 80 Productivity Rule.

1.3 – Beware of software patents

If you are in the U.S., beware of software patents. Some papers are patented and you could get into trouble for using them in commercial applications.

1.4 – Learn more about the field of the paper

If you are reading a paper about the use of Support Vector Machines (SVM) in the context of Computational Neuroscience, then you should read a short introduction to Machine Learning and the different types of classifiers that could be alternatives to SVM, and you should as well read general articles about Computational Neuroscience to know what is being done in research right now.

1.5 – Stay motivated

If you have never implemented a paper and/or if you are new to the domain of the paper, then the reading can be very difficult. Whatever happens, do not let the amount and the complexity of the mathematical equations discourage you. Moreover, speed is not an issue: even if you feel that you understand the paper slower than you wish you would, just keep on working, and you will see that you will slowly and steadily understand the concepts presented in the paper, and pass all difficulties one after the other.

2 – Three kinds of papers

It is never a good idea to pick a random paper and start implementing in right away. There are a lot of papers out there, which means there is a lot of garbage. All publications can fit into three categories:

2.1 – The groundbreaking paper

Some really interesting, well-written, and original research. Most of these papers are coming out of top-tier universities, or out of research teams in smaller universities that have been tackling the problem for about six to ten years. The later is easy to spot: they reference their own publications in the papers, showing that they have been on the problem for some time now, and that they base their new work on a proven record of publications. Also, the groundbreaking papers are generally published in the best journals in the field.

2.2 – The copycat paper

Some research group that is just following the work of the groundbreaking teams, proposing improvements to it, and publishing their results of the improvements. Many of these papers lack proper statistical analysis and wrongly conclude that the improvements are really beating the original algorithm. Most of the time, they really are not bringing anything except for unnecessary additional complexity. But not all copycats are bad. Some are good, but it’s rare.

2.3 – The garbage paper

Some researchers really don’t know what they are doing and/or are evil. They just try to maintain their status and privileges in the academic institution at which they teach. So they need funding, and for that they need to publish, something, anything. The honest ones will tell you in the conclusion that they failed and that the results are accurate only N% of the time (with N being a bad value). But some evil ones will lie, and say that their research was a great success. After some time reading publications, it becomes easy to spot the garbage paper and ditch them.

3 – How to read a scientific paper

A lot has already been written on the topic, so I am not going to write much about it. A good starting point is: How to Read a Paper by Srinivasan Keshav. Below are a few points that I found useful while I was reading scientific publications.

3.1 – Find the right paper

What you want to implement is an original paper, one that started a whole domain. It is sometimes okay to pick a copycat paper, if you feel that it brings real improvements and consistency to a good but immature groundbreaking paper.

So let’s say you have a paper as your starting point. You need to do some research in its surroundings. For that, the strategy is to look for related publications, and for the publications being listed in the “References” section at the end of the paper. Go on Google Scholar and search for the titles and the authors. Does any of the papers you found do a better job than the paper you had originally? If yes, then just ditch the paper you were looking at in the first place, and keep the new one you found. Another cool feature of Google Scholar is that you can find papers that cite a given paper. This is really great, because all you have to do is to follow the chain of citations from one paper to the next, and you will find the most recent papers in the field. Finding the good paper from a starting point is all about looking for papers being cited by the current paper, and for papers citing the current paper. By moving back and forth in time you should find the paper that is both of high quality and fits your needs.

Important: note that at this stage of simple exploration and reckoning, you should not be reading and fully understand the papers. This search for the right paper should be done just by skimming over the papers and using your instinct to detect the garbage (this comes with experience).

3.2 – Do not read on the screen

Print the publication on hard paper and read the paper version. Also, do not reduce the size in order to print more on each page. Yes, you will save three sheets of paper, but you will lose time as you will get tired faster reading these tiny characters. Good font size for reading is between 11 and 13 points.

3.3 – Good timing and location

Do not read a paper in the middle of the night, do it at a moment of the day when your brain is still fresh. Also, find a quiet area, and use good lighting. When I read, I have a desk lamp pointing directly at the document.

3.4 – Marker and notes

Highlight the important information with a marker, and take notes in the margin of whatever idea that pops in your head as you read.

3.5 – Know the definitions of all the terms

When you are used to read mostly news articles and fiction, your brain is trained to fill-in meaning for words that you do not know, by using context as a deduction device. Reading scientific publications is a different exercise, and one of the biggest mistake is to assume false meaning for a word. For instance in this sentence “The results of this segmentation approach still suffer from blurring artifacts”. Here two words, “segmentation”, and “artifacts”, have a general meaning in English, but also have a particular meaning in the domain of Computer Vision. If you do not know that these words have a particular meaning in this paper, then while reading without paying attention, your brain will fill-in the general meaning, and you might be missing some very important information. Therefore you must (i) avoid assumptions about words, and whenever in doubt look up the word in the context of the domain the publication was written, and (ii) write a glossary on a piece of paper of all the concepts and vocabulary specific to the publication that you did not know before. If you encounter for the first time concepts such as “faducial points” and “piece-wise affine transform”, then you should look-up their precise definitions and write them down in your glossary. Concepts are language-enabled brain shortcuts, and allow you to understand the intent of the authors faster.

3.6 – Look for statistical analysis in the conclusion

If the authors present only one curve from their algorithm and one curve from another algorithm, and say “look, it’s 20% more accurate”, then you know you’re reading garbage. What you want to read is: “Over a testing set of N instances, our algorithm shows significant improvement with a p-value of 5% using a two-sample t-test.” The use of statistical analysis shows a minimum of driving from the author, and is a good proof that the results can be trusted for generalization (unless the authors lied to make their results look more sexy, which can always happen).

3.7 – Make sure the conclusions are demonstrating that the paper is doing what you need

Let’s say you want an algorithm that can find any face in a picture. The authors of the paper say in the conclusion that their model was trained using 10 poses from 80 different people (10 x 80 = 800 pictures), and that the accuracy of face detection with the training set was 98%, but was only 70% with the testing set (picture not used during training). What does this mean? This means that apparently, the algorithm has issues to generalize properly. It performs well when used on the training set (which is useless), and perform worse when used in real-world cases. What you should conclude at this point is that maybe, this paper is not good enough for what you need.

3.8 – Pay attention to the input data used by the authors

If you want to perform face detection with a webcam, and the authors have used pictures taken with a high-definition camera, then there are chances that the algorithm will not perform as well in your case as it did for the authors. Make sure that the algorithm was tested on data similar to yours or you will end up with a great implementation that is completely unusable in your real-world setup.

3.9 – Authors are humans

The authors are humans, and therefore they make mistakes. Do not assume that the authors are absolutely right, and in case an equation is really hard to understand or follow, you should ask yourself whether or not the authors made a mistake there. This could just be a typo in the paper, or an error in the maths. Either case, the best way to find out is to roll out the equations yourself, and try to verify their results.

3.10 – Understand the variables and operators

The main task during the implementation of a publication is the translation of math equations in the paper into code and data. This means that before jumping into the code, you must understand 100% of the equations and processes on these equations. For instance, “C = A . B” could have different meaning. A and B could be simple numbers, and the “.” operator could simply be a product. In that case, C would be the product of two numbers A and B. But maybe that A and B are matrices, and that “.” represents the matrix product operator. In that case, C would be the product matrix of the matrices A and B. Yet another possibility is that A and B are matrices and that “.” is the term-by-term product operator. In that case, each element C(i,j) is the product of A(i,j) and B(i,j). Notations for variables and operators can change from one mathematical convention to another, and from one research group to another. Make sure you know what each variable is (scalar, vector, matrix or something else), and what every operator is doing on these variables.

3.11 – Understand the data flow

A paper is a succession of equations. Before you start coding, you must know how you will plug the output of equation N into the input of equation N+1.

4 – Prototyping

Once you have read and understood the paper, it’s time to create a prototype. This is a very important step and avoiding it can result in wasted time and resources. Implementing a complex algorithm in languages such as C, C++ or Java can be very time consuming. And even if you have some confidence in the paper and think the algorithm will work, there is still a chance that it won’t work at all. So you want to be able to code it as quickly as possible in the dirtiest way, just to check that it’s actually working.

4.1 – Prototyping solutions

The best solution for that is to use a higher level versatile language or environment such as Matlab, R, Octave or SciPy/NumPy. It is not that easy to represent a mathematical equation in C++ and then print the results to manually check them. On the contrary, it is extremely straightforward to write equations in Matlab, and then print them. What would take you two to three weeks in C++ will take take you two days in Matlab.

4.2 – Prototyping helps the debugging process

An advantage of having a prototype is that when you will have your C++ version, you will be able to debug by comparing the results between the Matlab prototype and the C++ implementation. This will be developed further in the “Debugging” section below.

4.3 – Wash-off implementation issues beforehand

You will certainly make software design mistakes in your prototype, and this is a good thing as you will be able to identify where are the difficulties with both the processes or data. When you will code the C++ version, you will know how to better architect the software, and you will produce way cleaner and more stable code than you would have without the prototyping step (this is the “throw-away system” idea presented by Frederick Brooks in The Mythical Man-Month).

4.4 – Verify the results presented in the paper

Read the “Experiment” section of the paper carefully, and try to reproduce the experimental conditions as closely as possible, by using test data as similar as possible to the ones used by the authors. This increases your chances of reproducing the results obtained by the authors. Not using similar conditions can lead you to a behavior of your implementation that you might consider as an error, whereas you are just not feeding it with the correct data. As soon as you can reproduce the results based on similar data, then you can start testing it on different kinds of data.

5 – Choose the right language and libraries

At this stage, you must have a clear understanding of the algorithm and concepts presented in the publication, and you must have a running prototype which convinces that the algorithm is actually working on the input data you wish to use in production. It is now time to go into the next step, which consists in implementing the publication with the language and framework that you wish to use in production.

5.1 – Pre-existing systems

Many times, the production language and libraries are being dictated by pre-existing systems. For instance, you have a set of algorithm for illumination normalization in a picture, in a library coded in Java, and you want to add a new algorithm from a publication. In that case, obviously, you are not going to code this new algorithm in C++, but in Java.

5.2 – Predicted future uses of the implementation

In the case there is no pre-existing system imposing you a language, then the choice of the language should be done based upon the predicted uses of the algorithm. For example, if you believe that within four to six months, a possible port of your application will be done to the iPhone, then you should choose C/C++ over Java as it would be the only way to easily integrate the code into an Objective-C application without having to start everything from scratch.

5.3 – Available libraries that solve fully or partly the algorithm

The available libraries in different languages can also orient the choice of the production language. Let’s imagine that the algorithm you wish to implement makes use of well-known algebra techniques such as principal component analysis (PCA) and singular value decomposition (SVD). Then you could either code PCA and SVD from scratch, and if there is a bug could end up debugging for a week, or you could re-use a library that already implements these techniques and write the code of your implementation using the convention and Matrix class of this library. Ideally, you should be able to decompose your implementation into sub-tasks, and try to find libraries that already implement as many of these sub-tasks as possible. If you find the perfect set of libraries that are only available for a given language, then you should pick that language. Also, note that the choice of libraries should be a trade-off between re-using existing code and minimizing dependencies. Yes, it is good to have code for every sub-task needed for your implementation, but if that requires to create dependencies over 20 different libraries, then it might be not very practical and can even endanger the future stability of your implementation.

6 – Implementation

Here are some tips from my experience in implementing publications

6.1 – Choose the right precision

The type you will use for your computation should be chosen carefully. It is generally way better to use double instead of float. The memory usage can be larger, but the precision in the calculation will greatly improve, and is generally worth it. Also, you should be aware of the differences between 32-bit and 64-bit systems. Whenever you can, create your own type to encapsulate the underlying type (float or double, 32-bit or 64-bit), and use this type in your code. This can be done with a define is C/C++ or a class in Java.

6.2 – Document everything

Although it is true that over-documenting can slow down a project dramatically, in the case of the implementation of a complex technical paper, you want to comment everything. Even if you are the only person working on the project, you should document your files, classes and methods. Pick a convention like Doxygen or reStructuredText, and stick to it. Later in the development, there will be a moment where you will forget how some class works, or how you implemented some method, and you will thank yourself for documenting the code!

6.3 – Add references to the paper in your code

For every equation from the paper that you implement, you need to add a comment citing the paper (authors and year) and either the paragraph number or the equation number. That way, when later re-reading the code, you will be able to connect directly the code to precise locations in the paper. These comments should look like:

// See Cootes et al., 2001, Equation 2.3
// See Matthews and Baker, 2004, Section 4.1.2

6.4 – Avoid mathematical notations in your variable names

Let’s say that some quantity in the algorithm is a matrix denoted A. Later, the algorithm requires the gradient of the matrix over the two dimensions, denoted dA = (dA/dx, dA/dy). Then the name of the the variables should not be “dA_dx” and “dA_dy”, but “gradient_x” and “gradient_y”. Similarly, if an equation system requires a convergence test, then the variables should not be “prev_dA_dx” and “dA_dx”, but “error_previous” and “error_current”. Always name things for what physical quantity they represent, not whatever letter notation the authors of the paper used (e.g. “gradient_x” and not “dA_dx”), and always express the more specific to the less specific from left to right (e.g. “gradient_x” and not “x_gradient”).

6.5 – Do not optimize during the first pass

Leave all the optimization for later. As you can never be absolutely certain which part of your code will require optimization. Every time you see a possible optimization, add a comment and explain in a couple of lines how the optimization should be implemented, such as:

// OPTIMIZE HERE: computing the matrix one column at a time
// and multiplying them directly could save memory

That way, you can later find all the locations in your code at which optimizations are possible, and you get fresh tips on how to optimize. Once your implementation will be done, you will be able to find where to optimize by running a profiler such as Valgrind or whatever is available in the programming language you use.

6.6 – Planning on creating an API?

If you plan on using your current code as a basis for an API that will grow with time, then you should be aware of techniques to create interfaces that are actually usable. For this, I would recommend the “coding against the library” technique, summarized by Joshua Bloch in his presentation How to Design a Good API and Why it Matters.

7 – Debugging

Implementing a new algorithm is like cooking a dish you never ate before. Even if it tastes kind of good, you will never know if this is what it was supposed to taste. Now we are lucky, since unlike for cooking, software development has some helpful trick to increase the confidence we have in an implementation.

7.1 – Compare results with other implementations

A good way to wash out the bugs is to compare the results of your code with the results of an existing implementation of the same algorithm. As I assume that you did correctly all the tasks in the “But before you jump” section presented above, you did not find any available implementation of the algorithm (or else you would have used it instead of implementing the paper!). As a consequence, the only other implementation that you have at this stage is the prototype that you programmed earlier.

The idea is therefore to compare the results of the prototype and the production implementation at every step of the algorithm. If the results are different, then one of the two implementations is doing something wrong, and you must find which and why. Precision can change (the prototype can give you x = 1.8966 and the production code x = 1.8965), and the comparison should of course take this into account.

7.2 – Talk with people who have read the paper

Once all the steps for both implementations (prototype and production) are giving the exact same results, you can gain some confidence that your code is bug free. However, there is still a risk that you made a mistake in your understanding of the paper. In that case, both implementations will give the same results for each step, and you will think that your implementations are good, whereas this just proves that both implementations are equally wrong. Unfortunately, there is no way that I know of to detect this kind of problems. Your best option is to find someone who has read the paper, and ask that person questions regarding the parts of the algorithm you are not sure about. You could even try to ask the authors, but your chances to get an answer are very low.

7.3 – Visualize your variables

While developing, it is always good to keep an eye on the content of the variables used by the algorithm. I am not talking about merely printing all the values in the matrices and data you have, but finding the visualization trick adapted to any variable in your implementation. For instance, if a matrix is suppose to represent the gradient of an image, then during the coding and debugging, you should have a window popping up and showing that gradient image, not just the number values in the image matrix. That way, you will associate actual an image with the data you are handling, and you will be capable of detecting when there is a problem with one of the variables, which in turn will indicate a possible bug. Inventive visualization tricks include images, scatter plots, graphs, or anything that is not just a stupid list of 1,000 numbers and upon which you can associate a mental image.

7.4 – Testing dataset

Generating data to experiment with your implementation can be very time consuming. Whenever you can, try to find databases (face database, text extract databases, etc.) or tools for generating such data. If there are none, then do not lose time generating 1000 samples manually. Code a quick data generator in 20 lines and get done with it.

Conclusion

In this article, I have presented good practices for the implementation of a scientific publication. Remember that these are only based on my personal experience, and that they should not be blindly followed word for word. Always pay attention when you read and code, and use your judgement to determine which of the guidelines presented above fit your project. Maybe some of the practices will hurt your project more than it will help it, and that’s up to you to find out.

Now go implement some cool algorithm!

References

How to Read a Paper by Srinivasan Keshav
How to Design a Good API and Why it Matters by Joshua Bloch
The Mythical Man-Month by Frederick Brooks
The 20 / 80 Productivity Rule by Emmanuel Goossaert
Google Scholar

LEGO Goes Linux - InternetNews.

$
0
0

Comments:"LEGO Goes Linux - InternetNews."

URL:http://www.internetnews.com/blog/skerner/lego-goes-linux.html


From the 'What else would they use?' files:

Move over RaspberryPi and Arduino, there is a new maker on the 'block'.

I've been lusting after Arduino and RaspberryPi based maker initiatives since I first heard about them. Plug and play build your own electronics with Linux and open source goodness – it's just like LEGO people kept telling me.

Funny how times change. Now LEGO is set to embrace Linux in a limited way. The new MINDSTORMS EV3 robot playset will include Linux based firmware. Meaning, that Linux skills can now be used in a limited way to control/build/teach with LEGO.

"Fifteen years ago, we were among the first companies to help children use the power of technology to add life-like behaviors to their LEGO creations with the MINDSTORMS platform," said Camilla Bottke, LEGO MINDSTORMS project lead at The LEGO Group in a statement. "Now, we are equipping today’s tech-literate generation of children with a more accessible, yet sophisticated robotics kit that meets their tech play expectations and abilities to truly unleash their potential so that they may surprise, impress and excite the world with their creativity."

No, LEGO Mindstorms is not a replacement for an Arduino or a Raspberry Pi, in fact I personally hope to be able to own all three platforms (Mindstorms, Arduino and Raspberry Pi) myself. The LEGO move to Linux firmware is just a recognition that firmware should be Linux based if you want to make it easy to engage with developers and makers.

Sean Michael Kerner is a senior editor at InternetNews.com, the news service of the IT Business Edge Network, the network for technology professionals Follow him on Twitter @TechJournalist.

seattlerb/wilson · GitHub

$
0
0

Comments:"seattlerb/wilson · GitHub"

URL:https://github.com/seattlerb/wilson


Format Text

Headers

# This is an <h1> tag
## This is an <h2> tag
###### This is an <h6> tag

Text styles

*This text will be italic*
_This will also be italic_
**This text will be bold**
__This will also be bold__
*You **can** combine them*

Lists

Unordered

* Item 1
* Item 2
 * Item 2a
 * Item 2b

Ordered

1. Item 1
2. Item 2
3. Item 3
 * Item 3a
 * Item 3b

Miscellaneous

Images

![GitHub Logo](/images/logo.png)
Format: ![Alt Text](url)

Links

http://github.com - automatic!
[GitHub](http://github.com)

Blockquotes

As Kanye West said:> We're living the future so> the present is our past.

Code Examples in Markdown

Syntax highlighting with GFM

```javascript
function fancyAlert(arg) {
 if(arg) {
 $.facebox({div:'#foo'})
 }
}
```

Or, indent your code 4 spaces

Here is a Python code example
without syntax highlighting:
 def foo:
 if not bar:
 return true

Inline code for comments

I think you should use an
`<addr>` element here instead.

Nearby star is almost as old as the Universe : Nature News & Comment

$
0
0

Comments:"Nearby star is almost as old as the Universe : Nature News & Comment"

URL:http://www.nature.com/news/nearby-star-may-be-the-oldest-known-1.12196


The oldest known stars (one seen here in artists impression) date back at least 13.2 billion years.

ESO

Astronomers have discovered a Methuselah of stars — a denizen of the Solar System's neighbourhood that is at least 13.2 billion years old and formed shortly after the Big Bang.

“We believe this star is the oldest known in the Universe with a well determined age,” says Howard Bond, an astronomer at Pennsylvania State University in University Park, who announced the finding on 10 January at a meeting of the American Astronomical Society in Long Beach, California1.

The venerable star, dubbed HD 140283, lies at a comparatively short distance of 190 light years from the Solar System and has been studied by astronomers for more than a century. Researchers have long known that the object consists almost entirely of hydrogen and helium — a hallmark of having formed early in the history of the Universe, before successive generations of stars had a chance to forge heavier elements. But no one knew exactly how old it was.

Old timer

Determining the star’s age required several steps. First, Bond and his team made a new and more accurate determination of the star’s distance from the Solar System, using 11 sets of observations recorded between 2003 and 2011 using the Hubble Space Telescope’s Fine Guidance Sensors, which measure the position of target stars relative to reference stars. The astronomers also measured the brightness of the star as it appears in the sky, and were then able to calculate its intrinsic luminosity.

The team then exploited the fact that HD 140283 is in a phase of its life cycle in which it is exhausting the hydrogen at its core. In this phase, the star's slowly dimming luminosity is a highly sensitive indicator of its age, says Bond. His team calculates that the star is 13.9 billion years old, give or take 700 million years. Taking into account that experimental error, the age does not conflict with the age of the Universe, 13.77 billion years.

The star's age is therefore at least 13.2 billion years — which was the estimated age of another known Methuselah2 — and possibly older. Its age is known with considerably better confidence than that of the previous Methuselah, says Bond.

Early start

The discovery places constraints on early star formation, says Volker Bromm, an astronomer at the University of Texas at Austin. The very first generation of stars coalesced from primordial gas, which did not contain appreciable amounts of elements heavier than helium, he notes. That means that as old as HD 140283 is, its chemical composition — which includes a low but non-zero abundance of heavy elements — shows that the star must have formed after the first stellar generation.

Conditions for making the second generation of stars, then, “must have been in place very early”, says Bromm. The very first stars are usually thought to have coalesced a few hundred million years after the Big Bang, he notes. Massive and short lived, they died after only a few million years — exploding in supernovae that heated surrounding gas and seeded it with heavier elements.

But before the second generation of stars could form, that gas had to cool down. The early age of the second-generation star HD 140283 hints that the cooling time, or delay, between the first and second generations might have been extremely short, perhaps only a few tens of million years, says Bromm.

Viewing all 9315 articles
Browse latest View live